I'm Amaya Verde
Visual journalist. I find stories that need to be told and the visual form to tell them.
Selected visual stories

The Washington Post
View project →
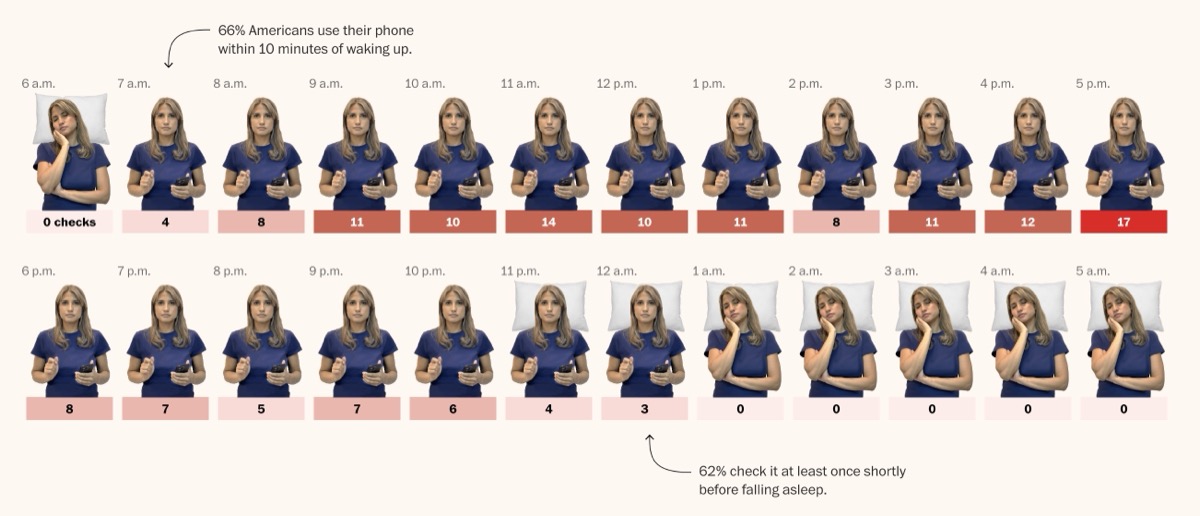
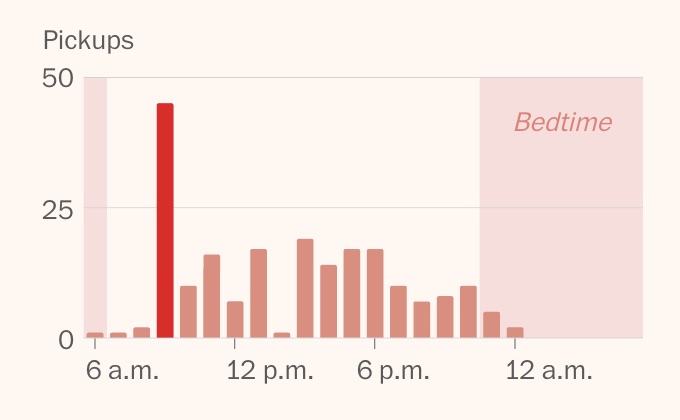
My role
I pitched and reported this story after asking myself: how often was I reaching for my phone, and what was it doing to my focus? I spoke with researchers, contacted YouGov, who ran a tailored survey on American phone habits, and collected real usage data from high-frequency users to build Amy, a composite character reflecting actual behavior.
Visual Story • Pitch • Concept • Reporting • Writing • Graphics • Design
Tools used
The Washington Post
View project →
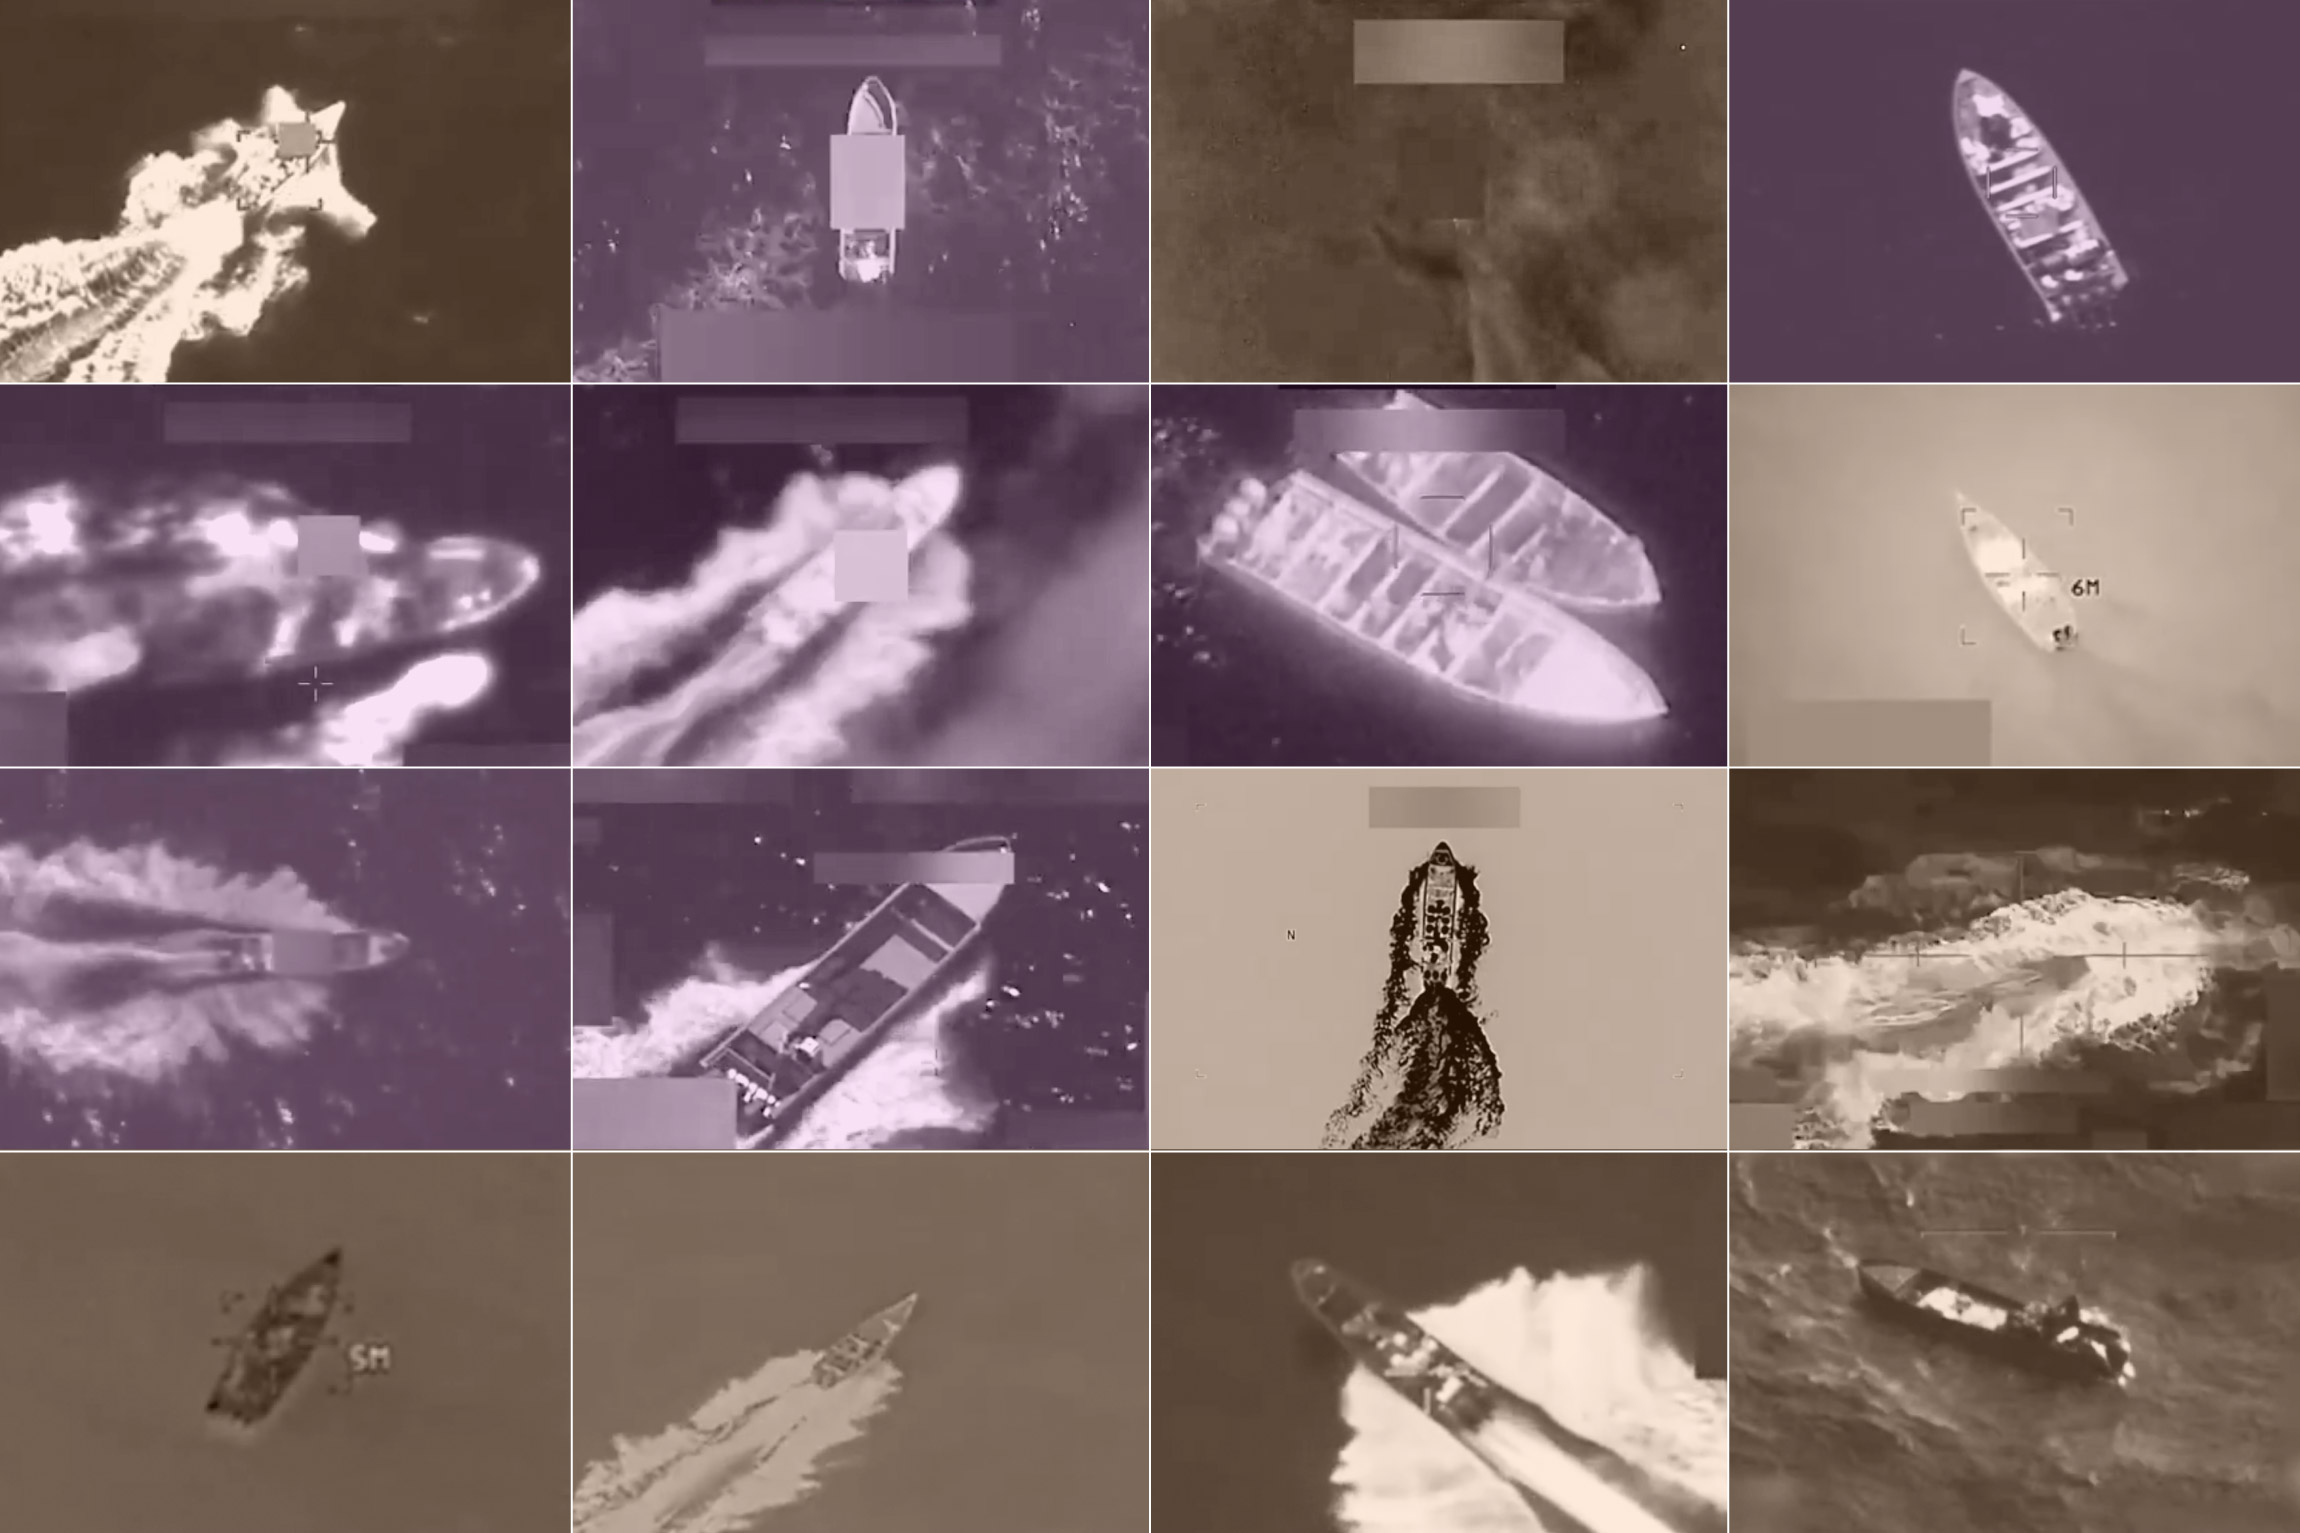
My role
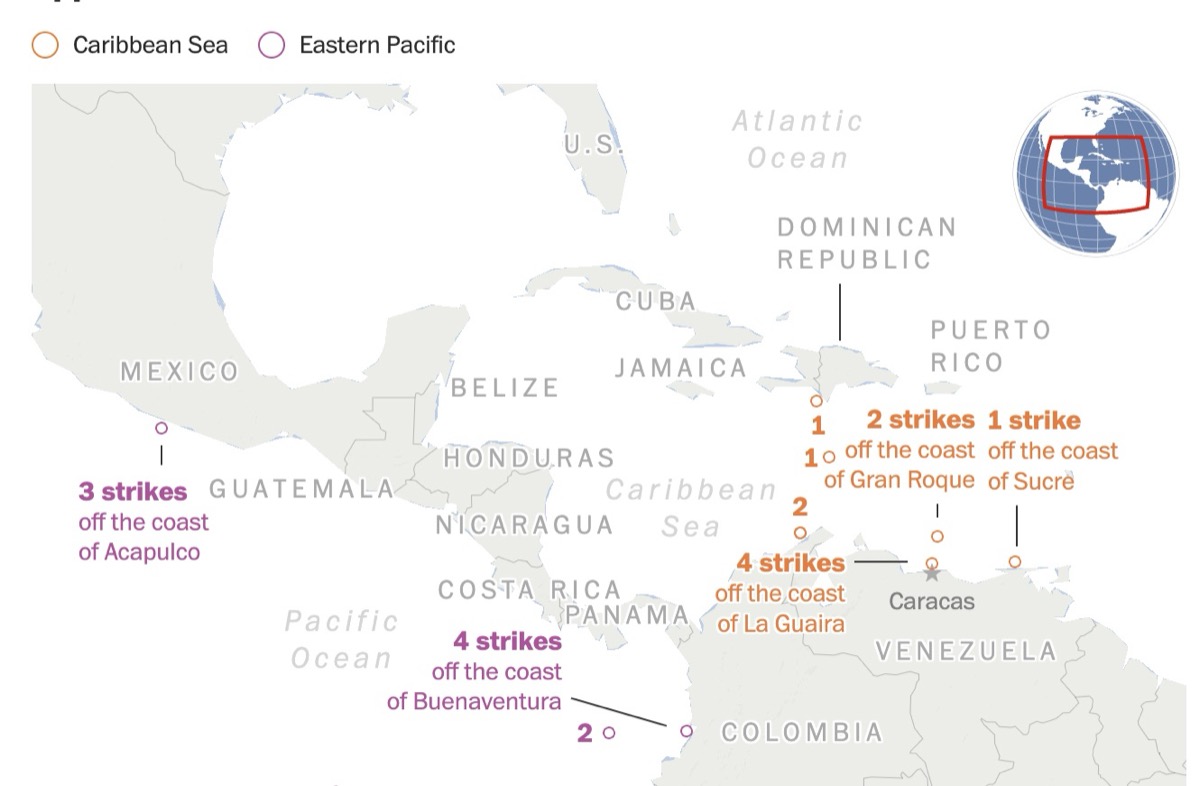
I proposed and reported this developing story. From the first strikes, I tracked counts and sourced data on confirmed locations, filtering specific attacks and verifying methodology throughout. I used color coding to distinguish Caribbean from Pacific strikes, since news coverage focused almost entirely on Venezuela while many attacks were actually occurring in the Pacific.
Visual Story • Pitch • Concept • Reporting • Writing • Graphics
Tools used
The Washington Post
View project →
My role
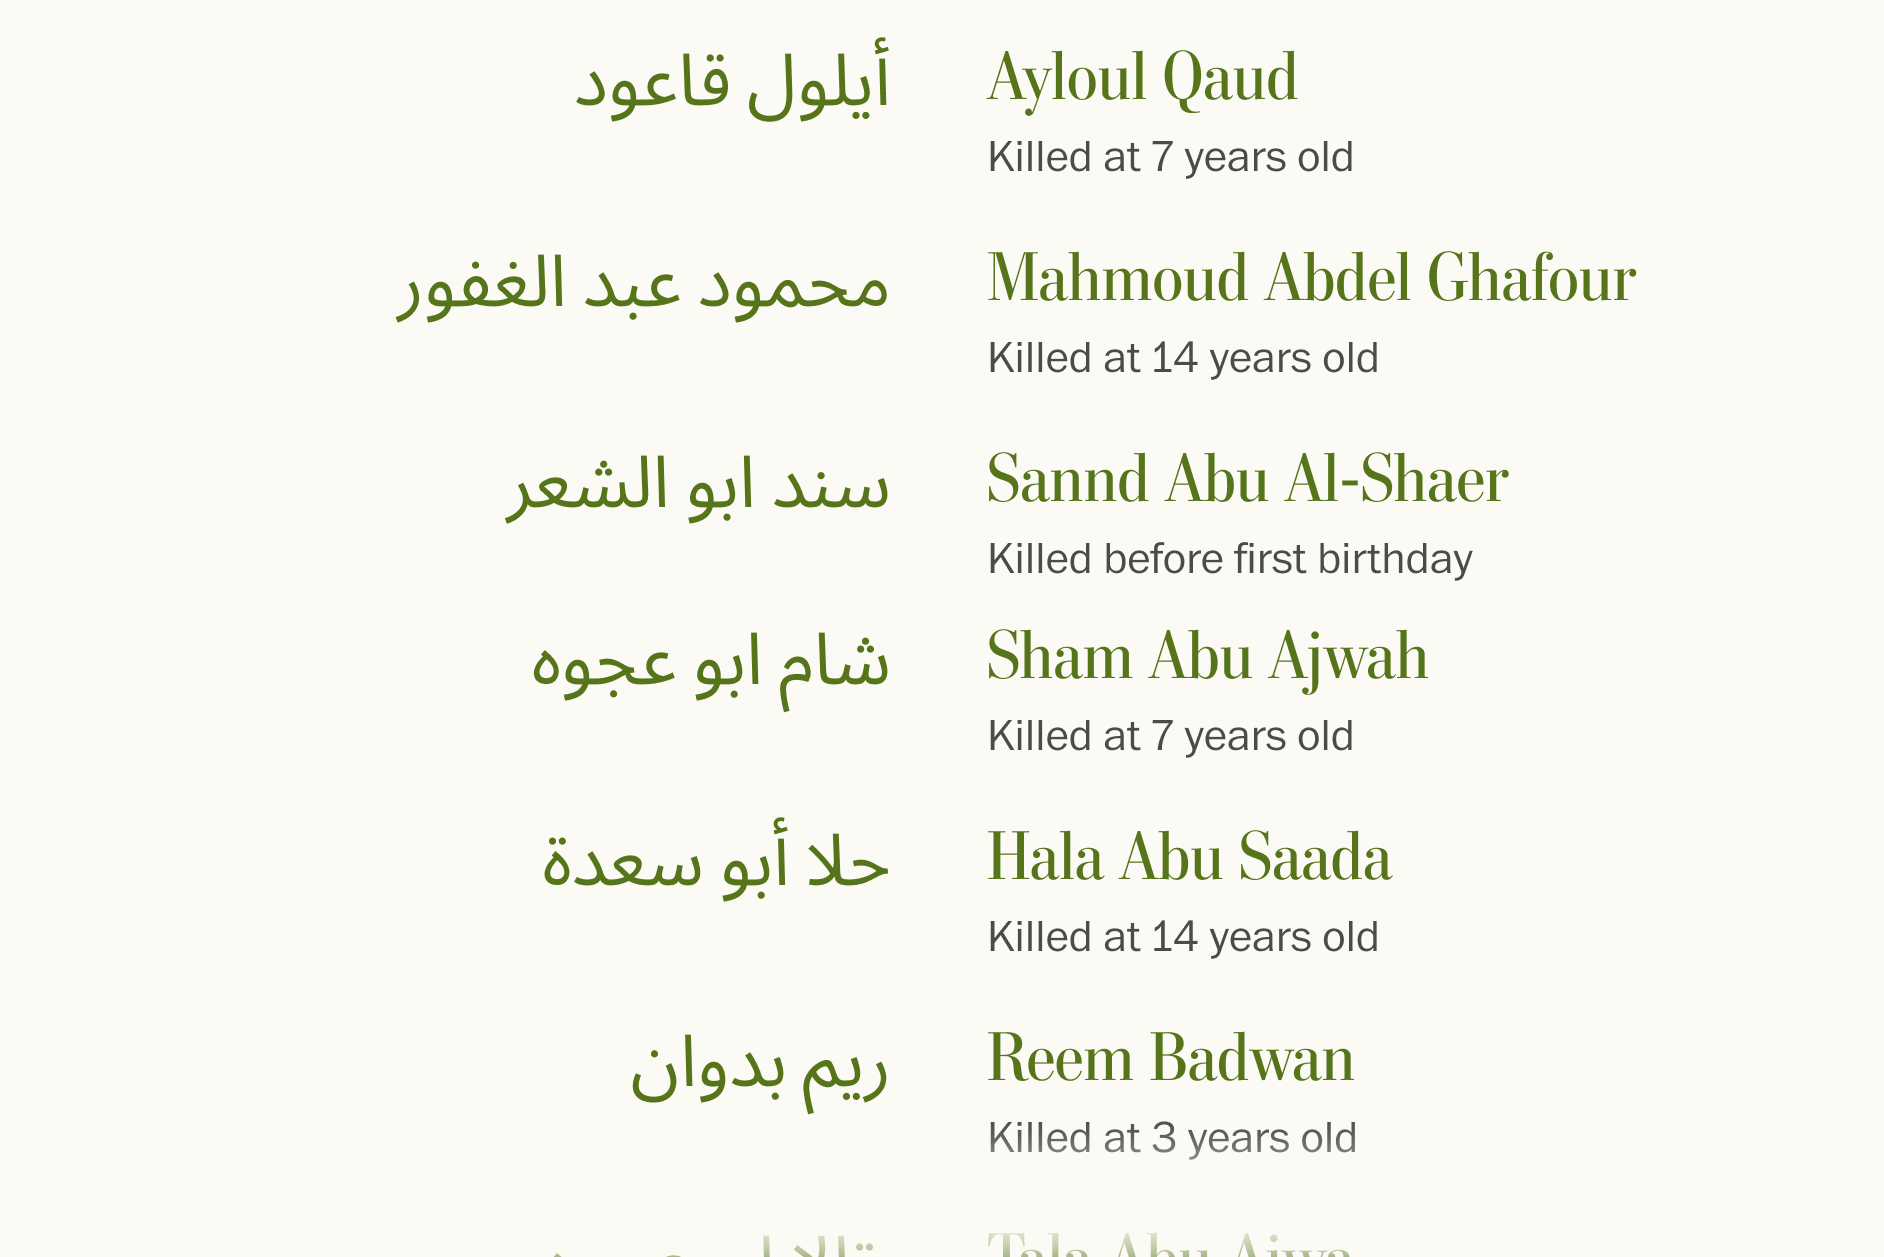
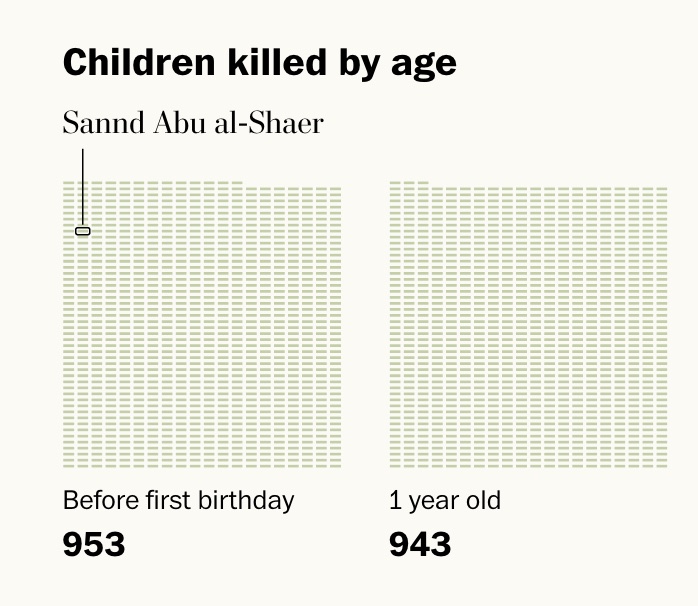
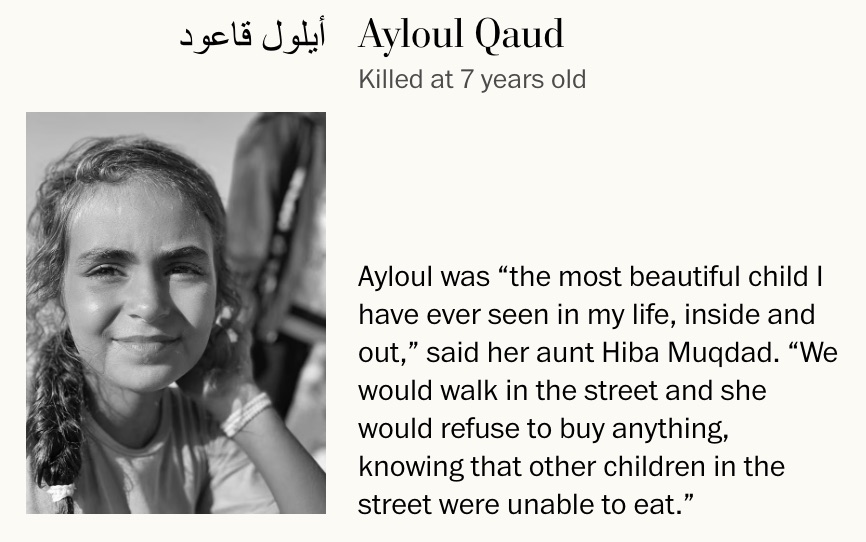
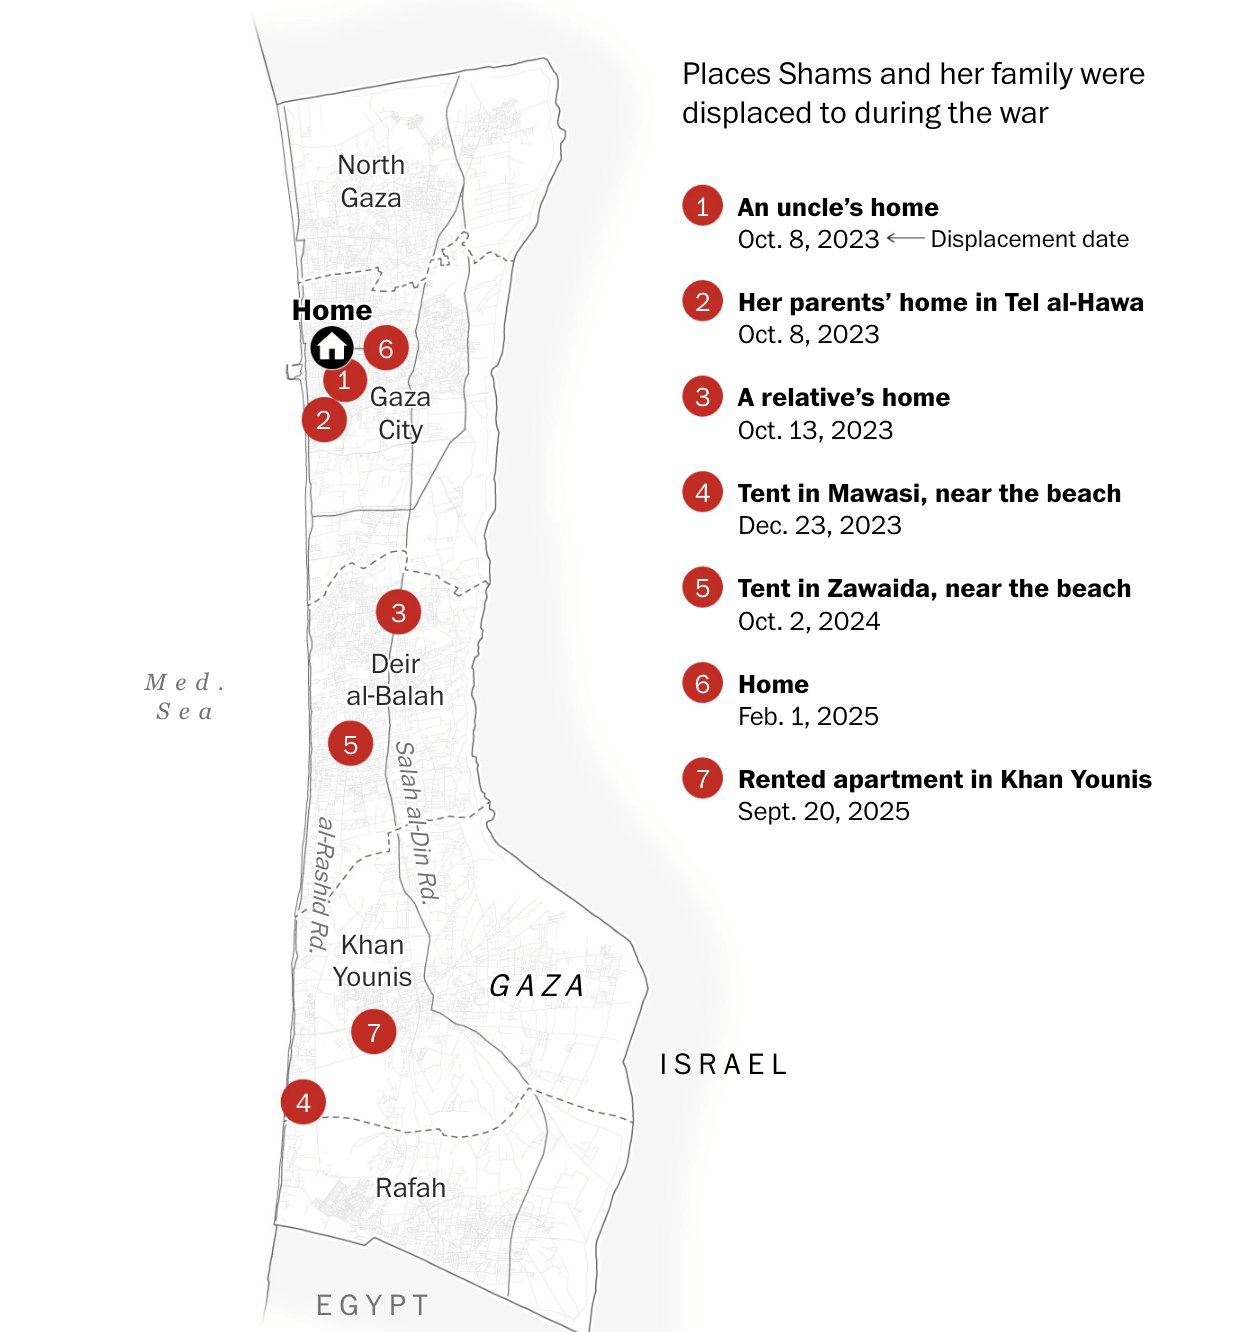
I approached the design of this human-centered memorial with great care and delicacy, handling concept, information design, data work, and graphics. The structure was designed to honor individual lives while conveying the scale of loss.
Concept • Information Design • Data Visualization • Graphics
Tools used
The Washington Post
View project →
My role
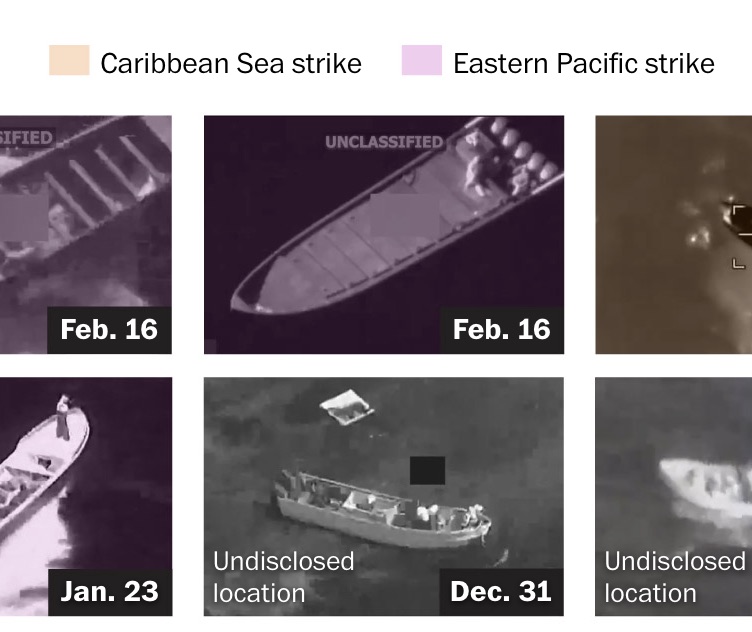
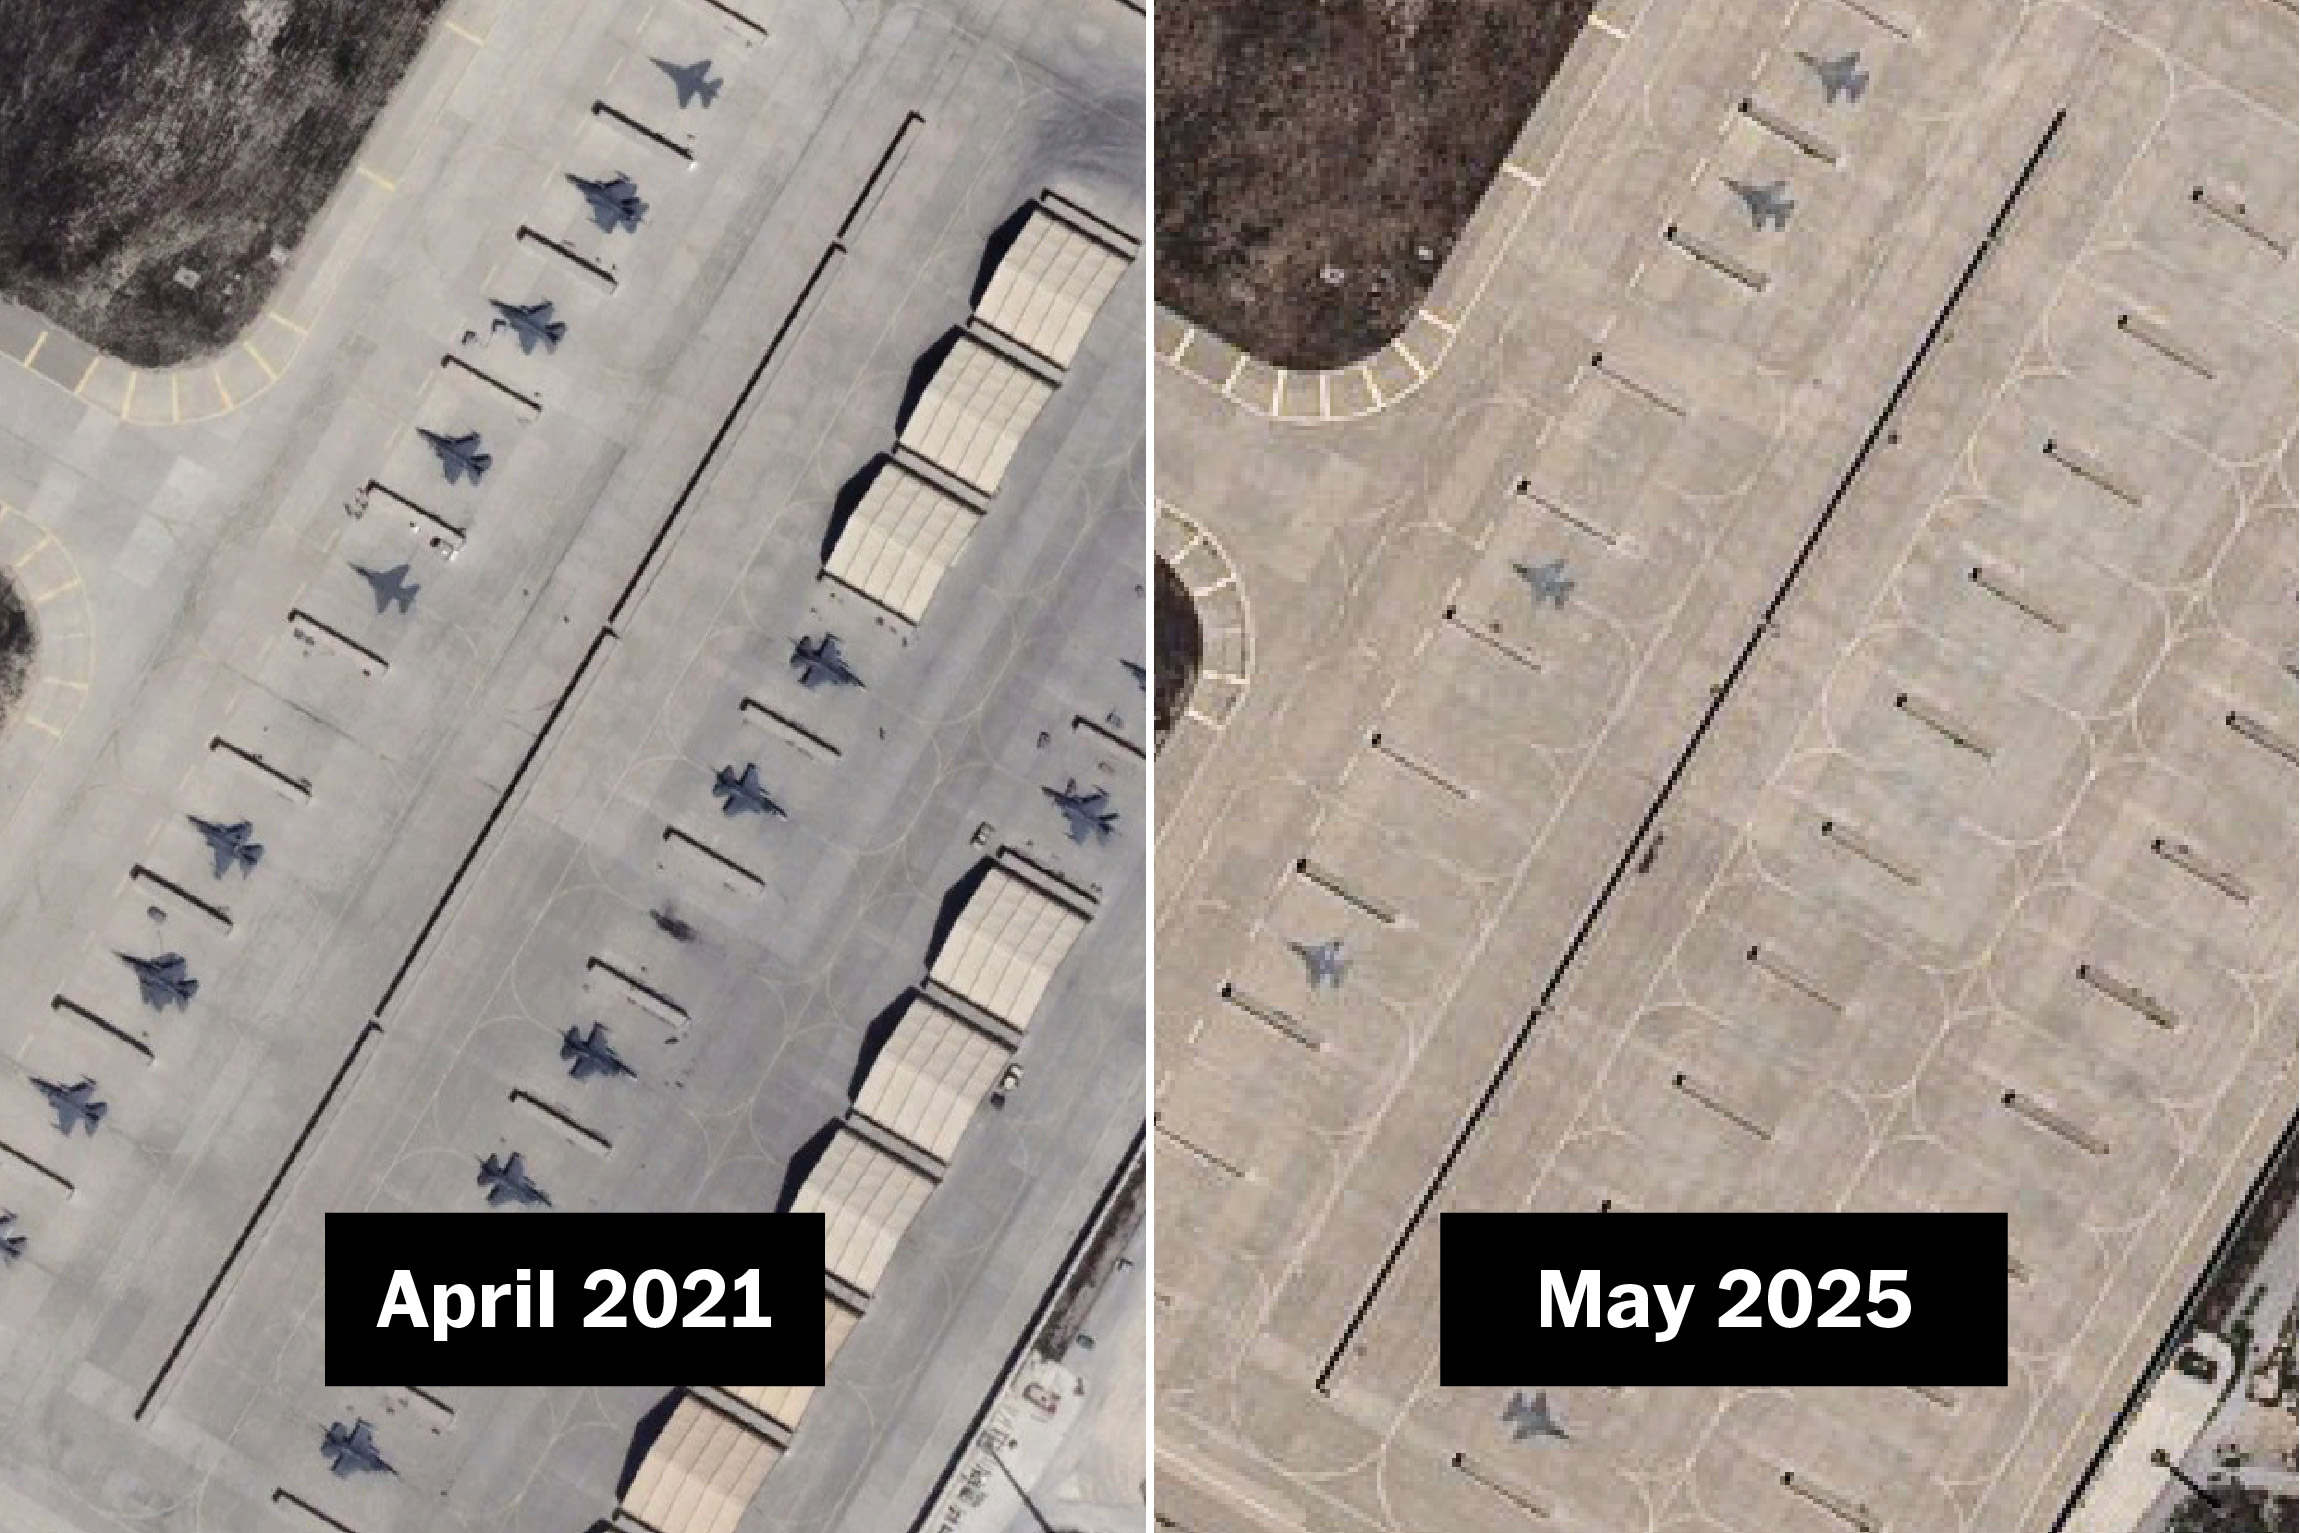
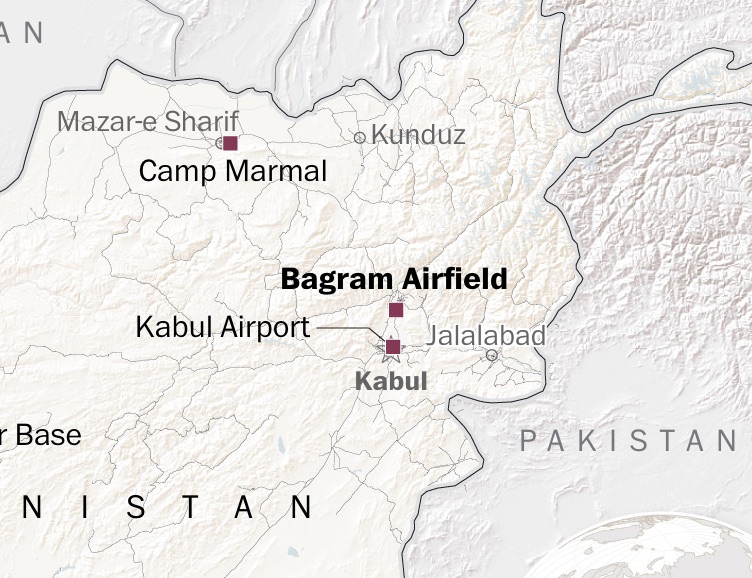
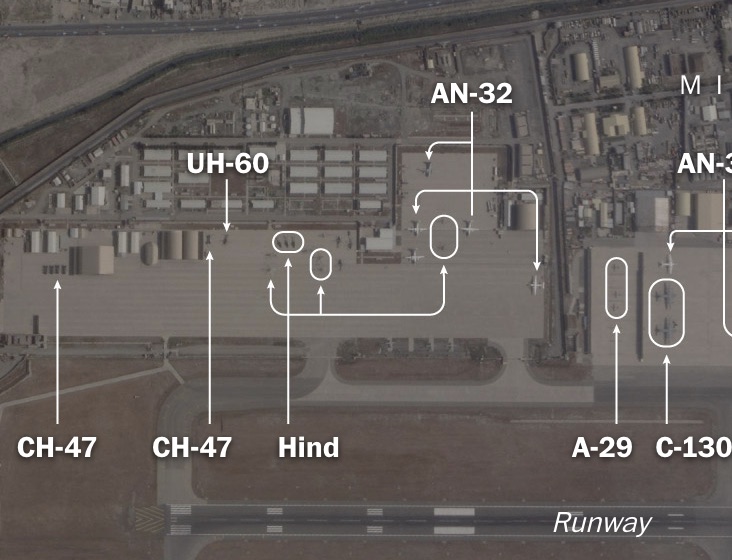
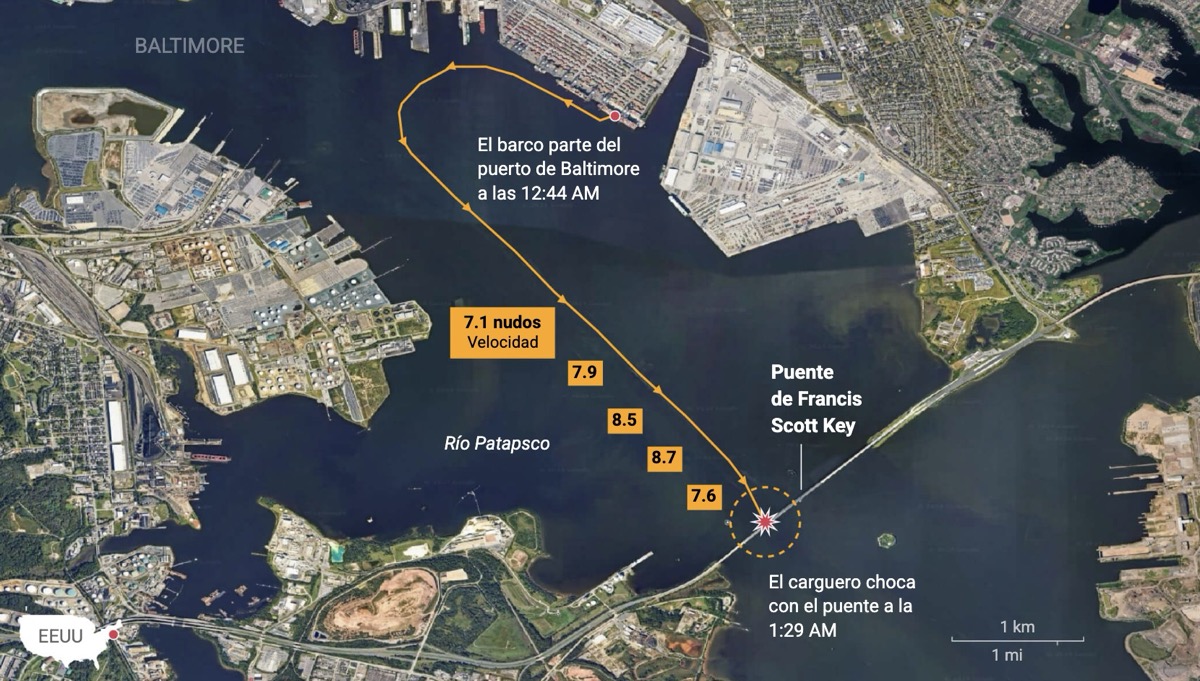
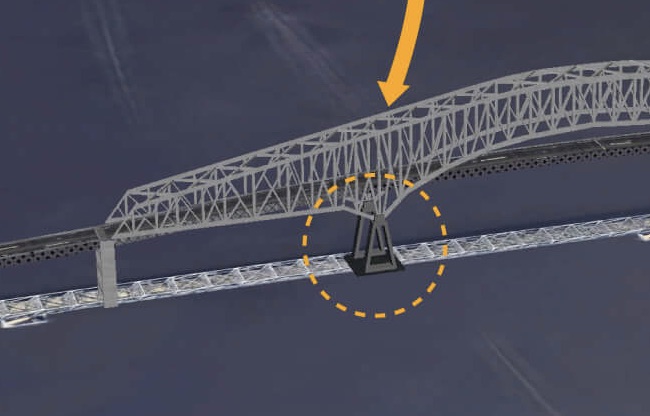
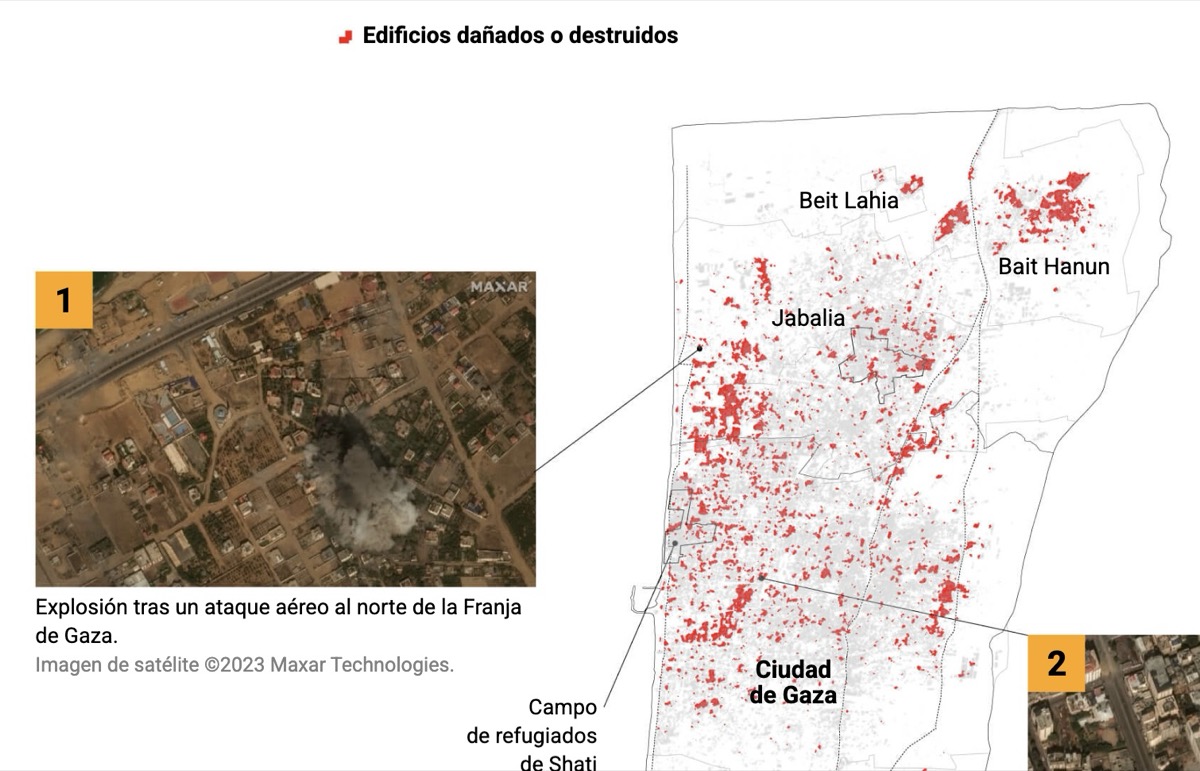
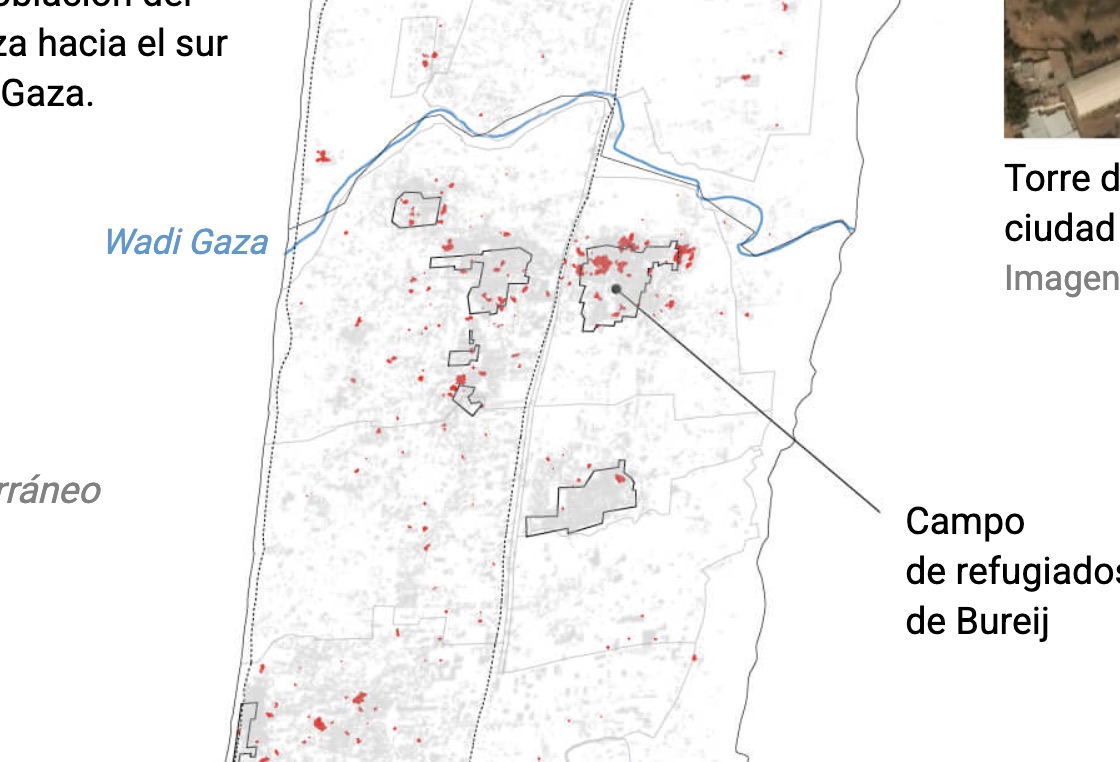
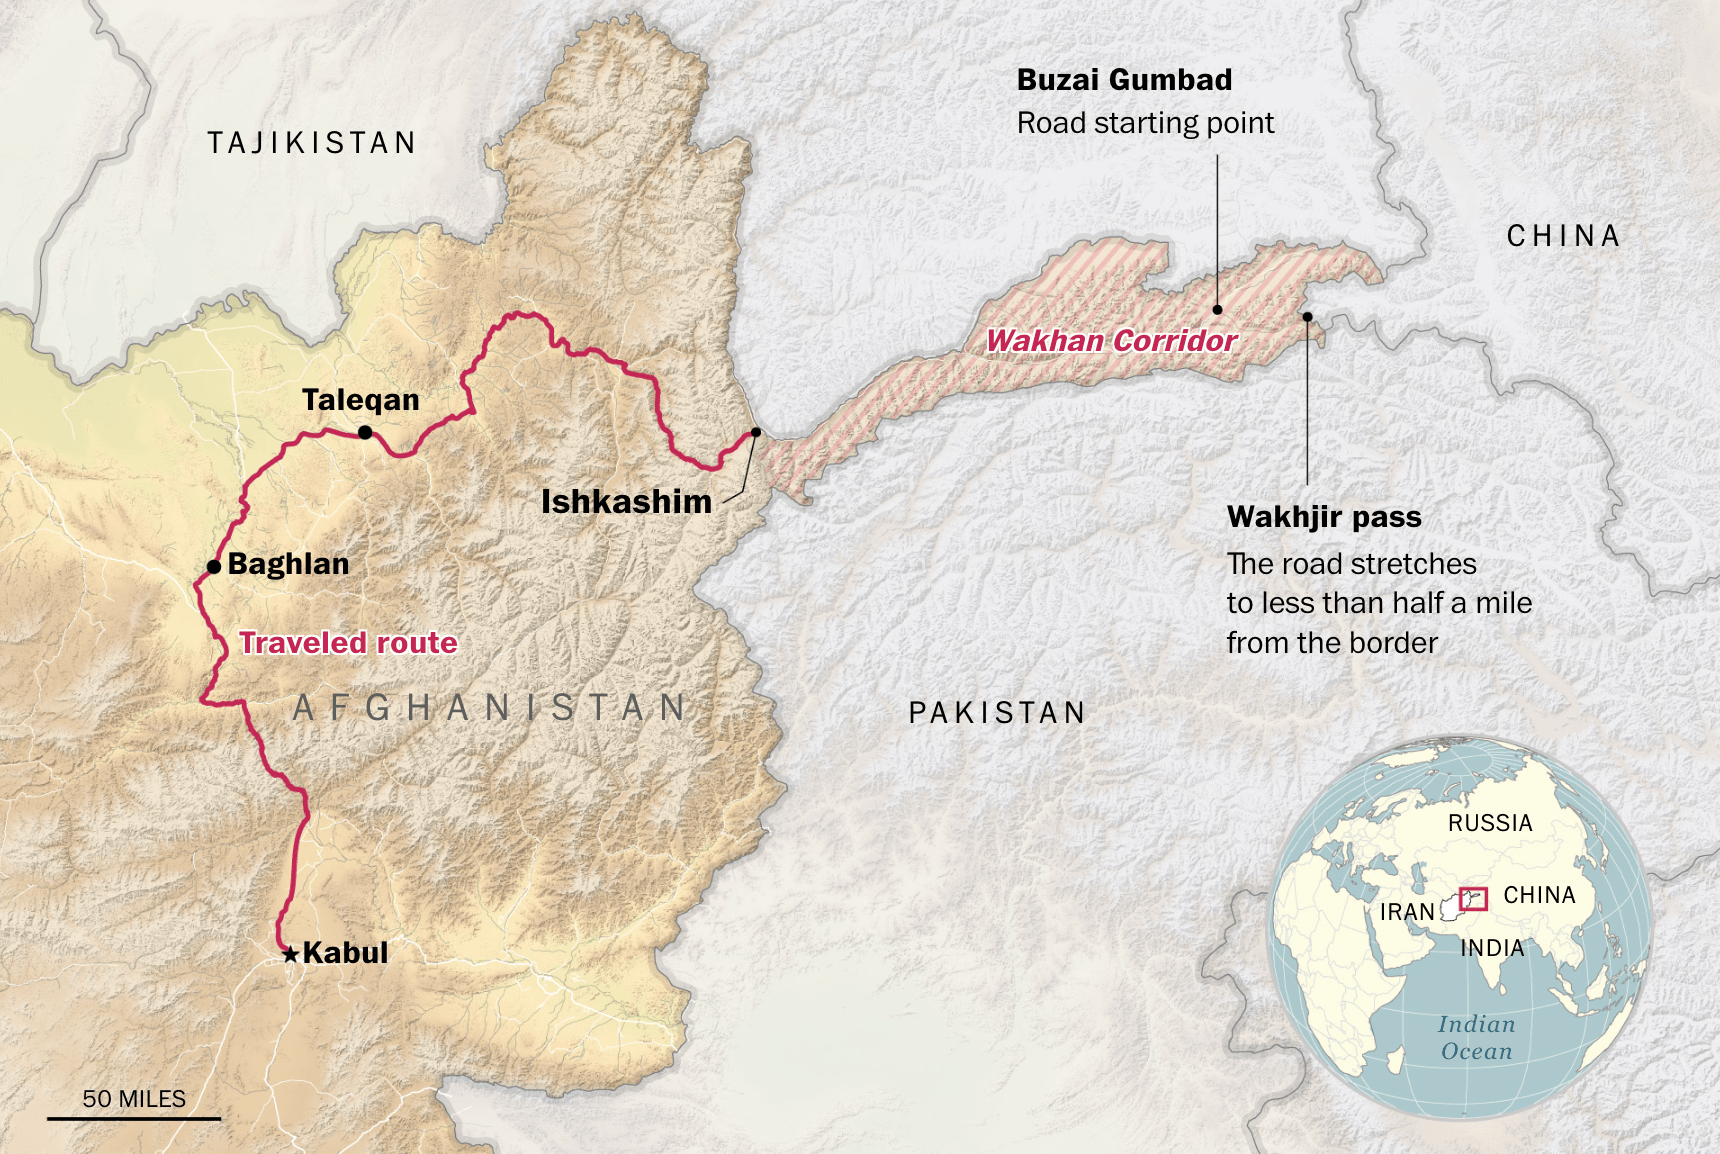
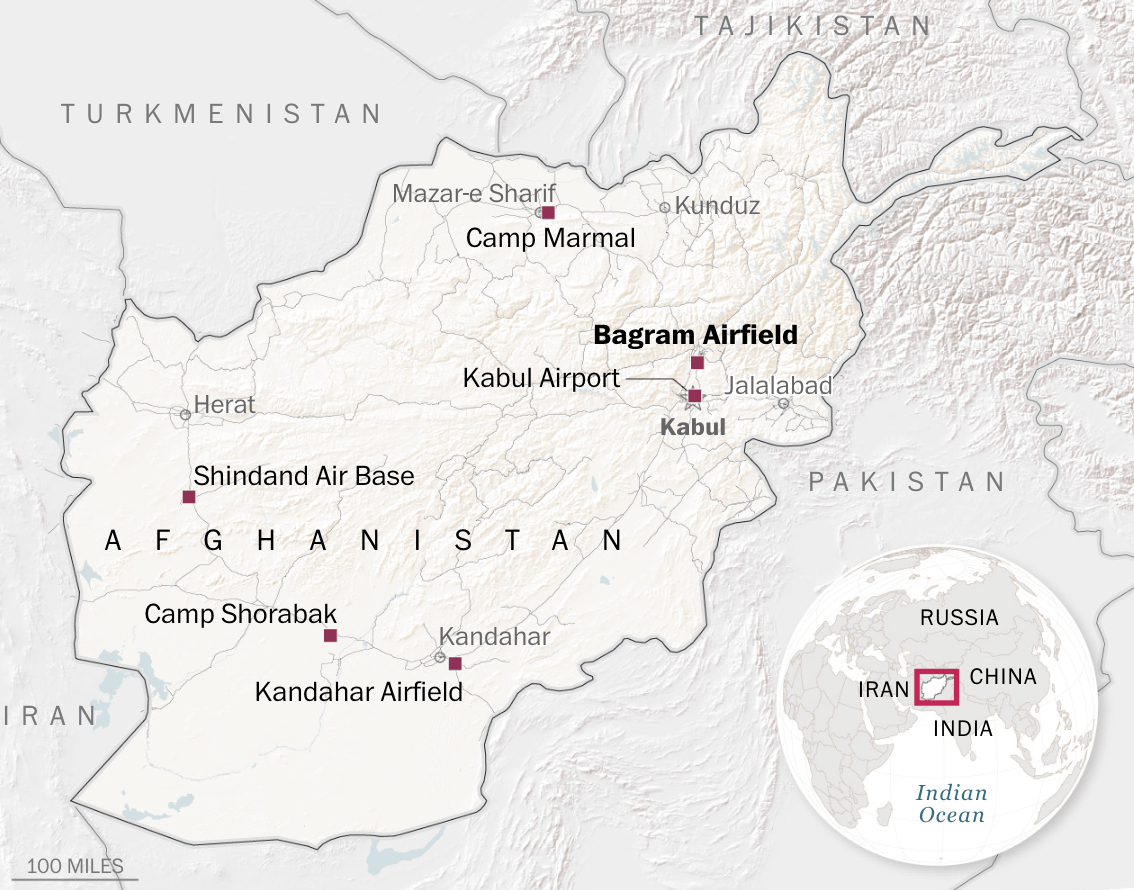
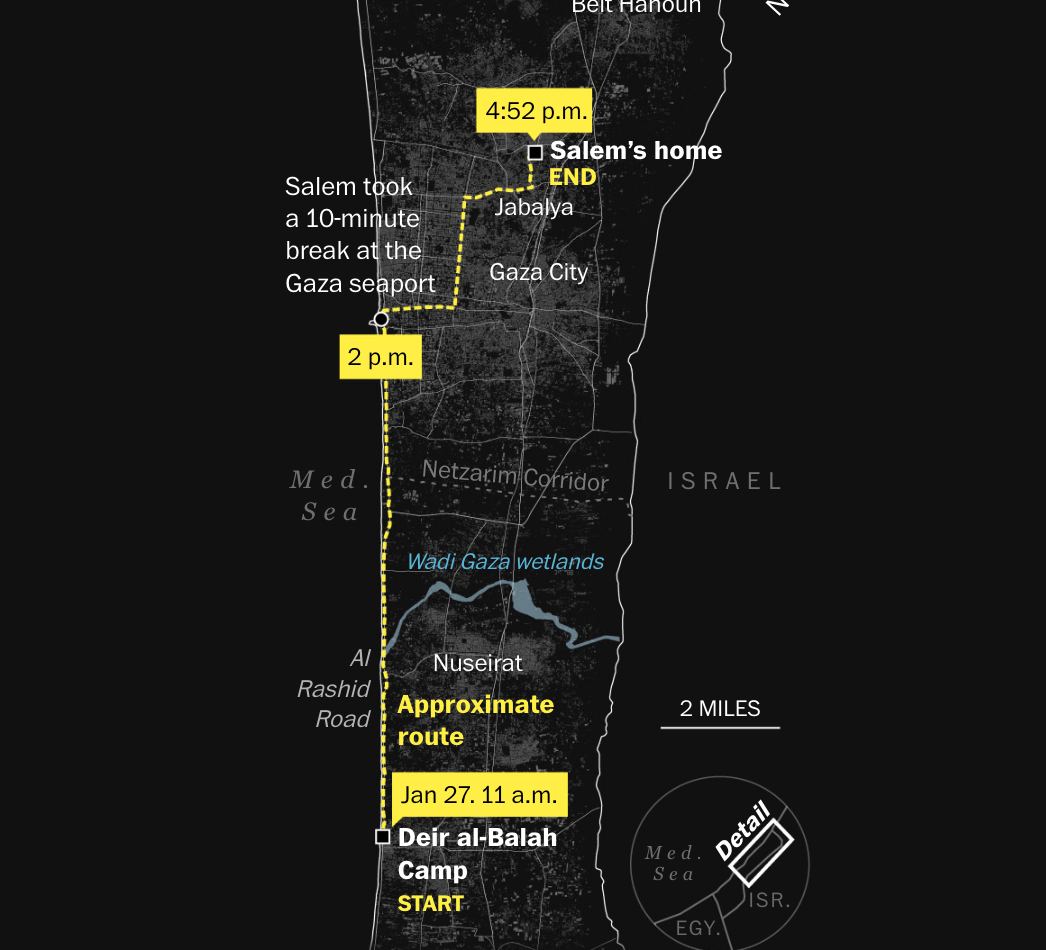
I worked on this visual analysis, outlining the story structure early in the reporting process and translating satellite imagery analysis into a custom scrollytelling experience that connected the visual evidence to the wider narrative. A case where graphics drove the reporting.
Visual Story • Concept • Satellite Imagery Analysis • Maps • Graphics
Tools used
The Washington Post
View project →
My role
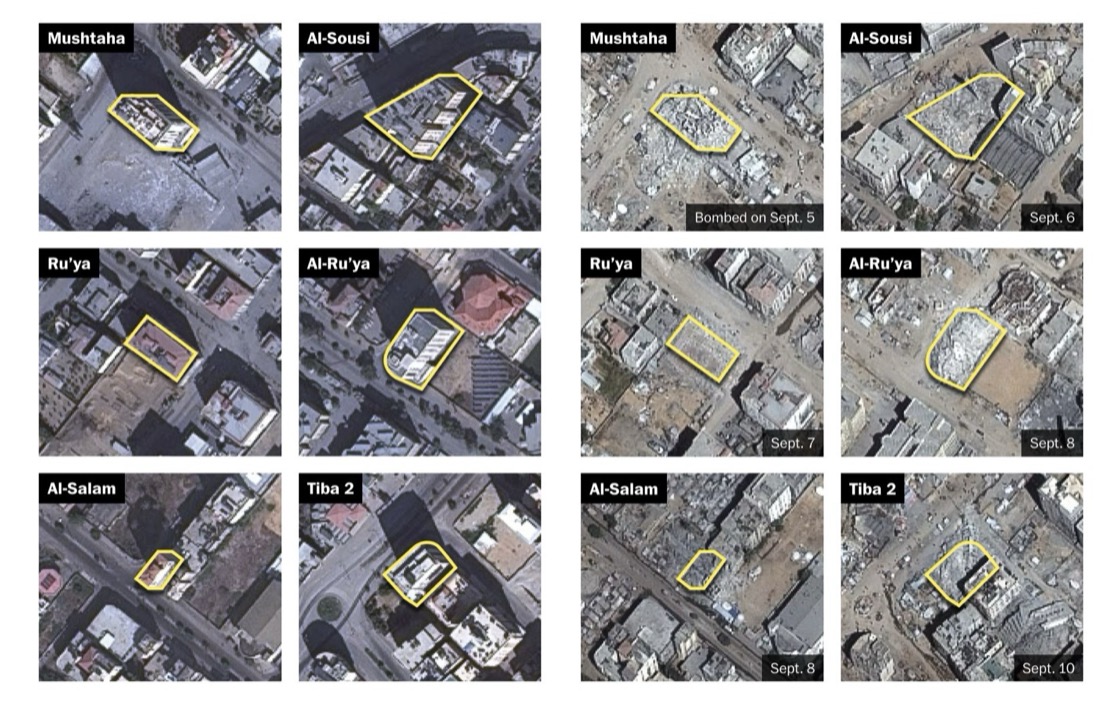
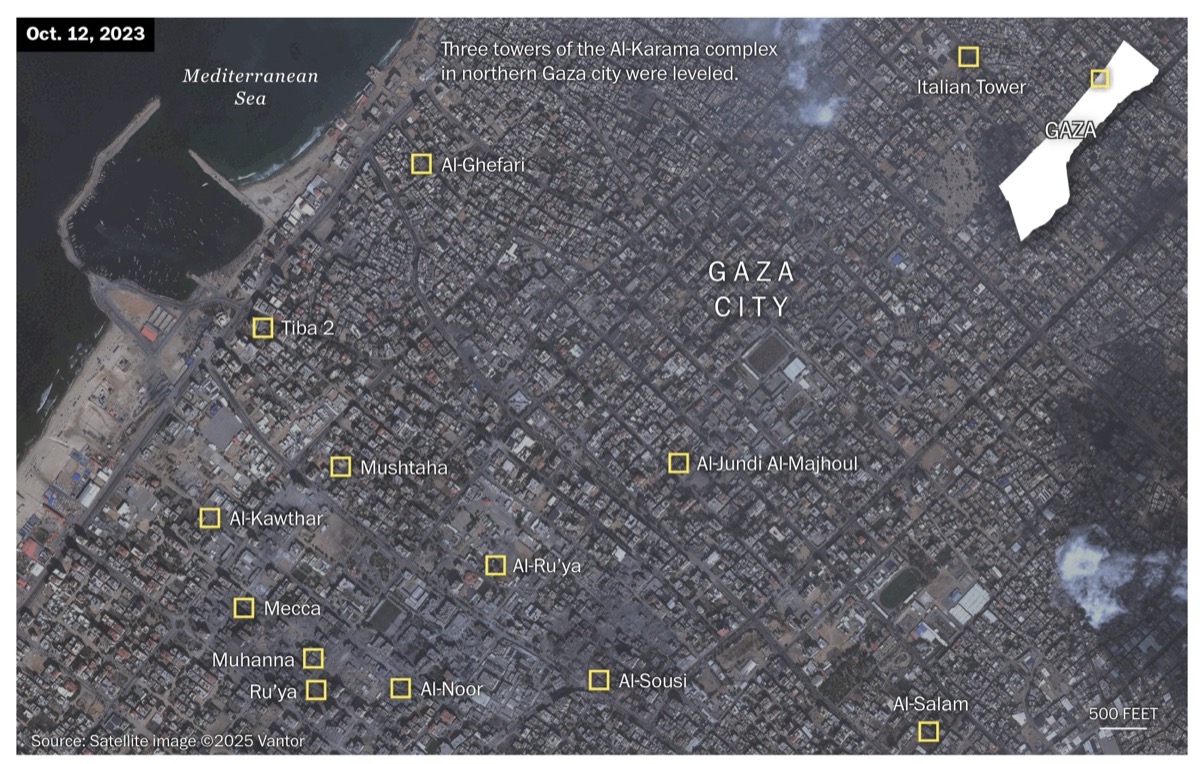
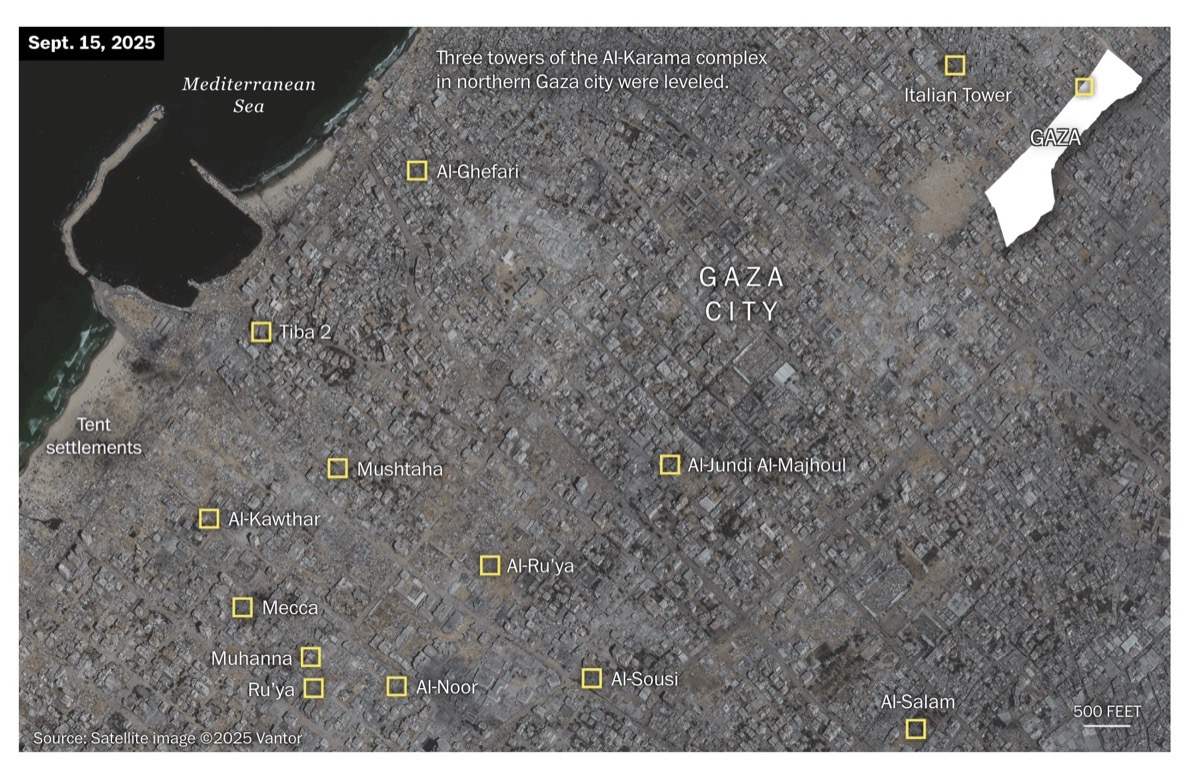
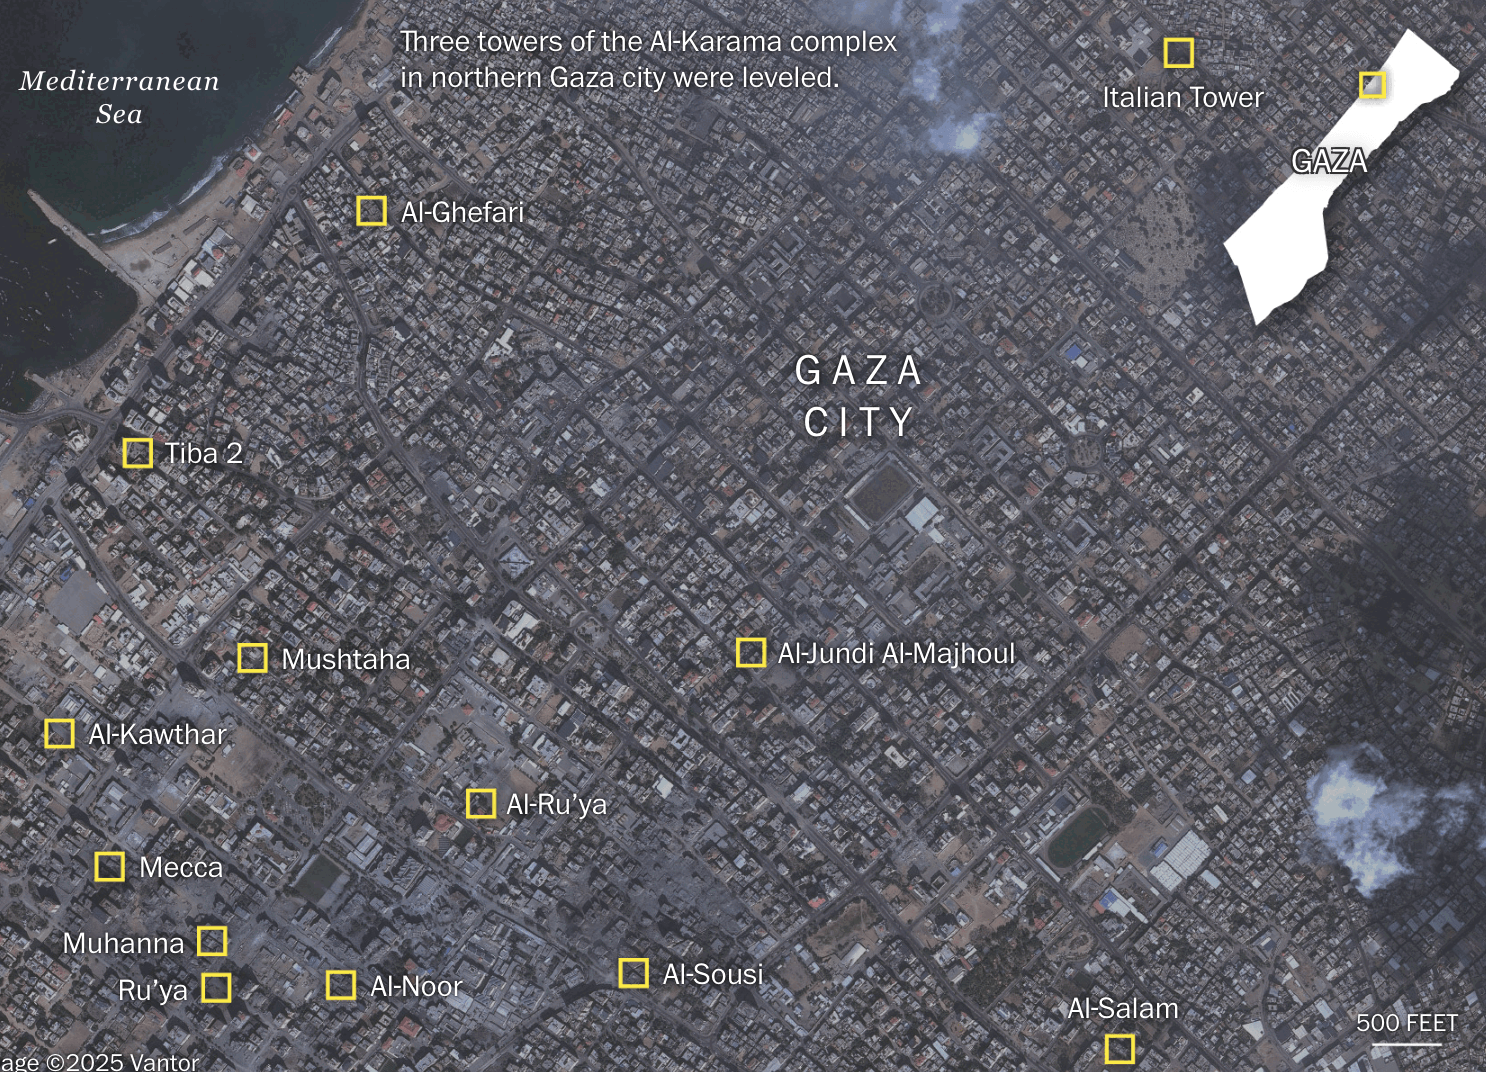
For this collaborative piece on the destruction of Gaza City's high-rises, I proposed and designed a scrollytelling transition showing satellite close-ups of each bombed building before and after, paired with an overview map showing the full scale of the destruction across the city.
Visual Story • Concept • Satellite Imagery Analysis • Maps
Tools used
The Washington Post
View project →
My role
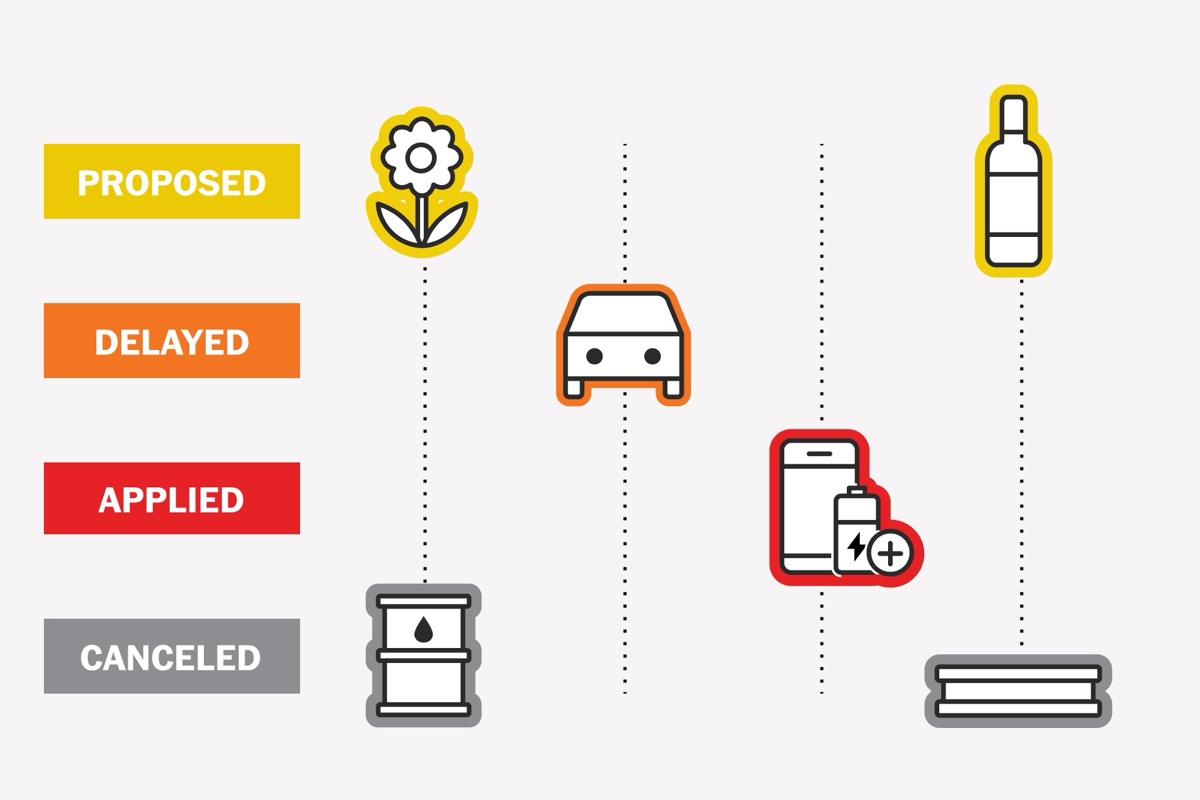
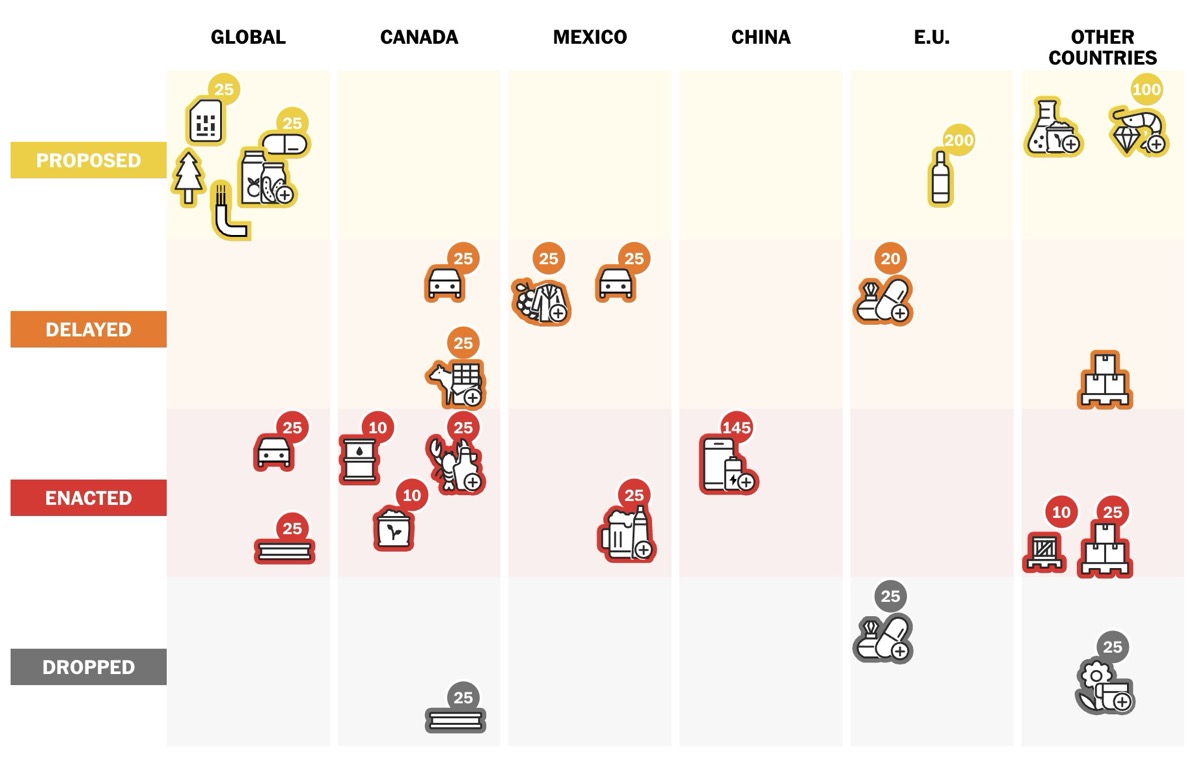
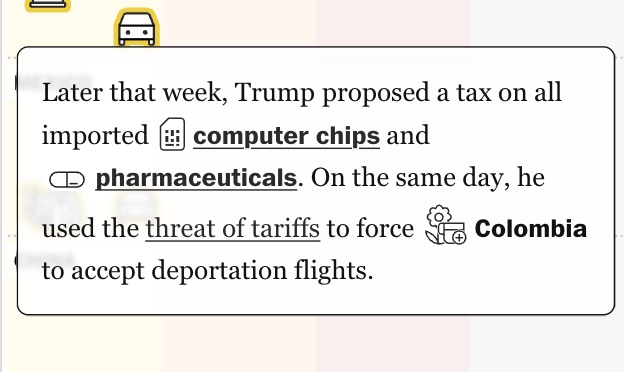
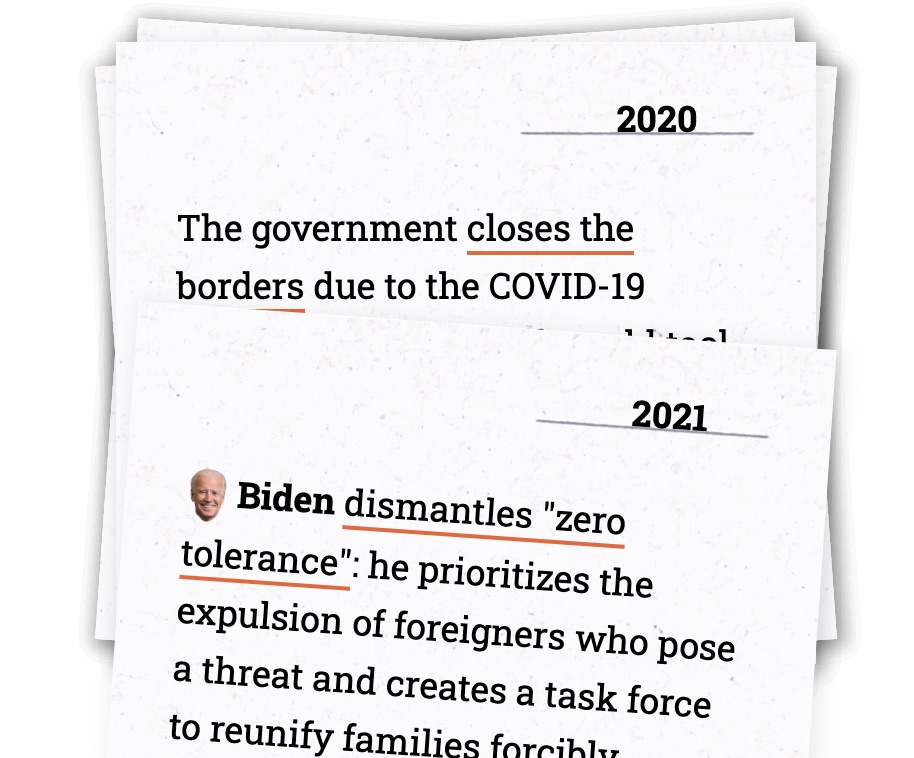
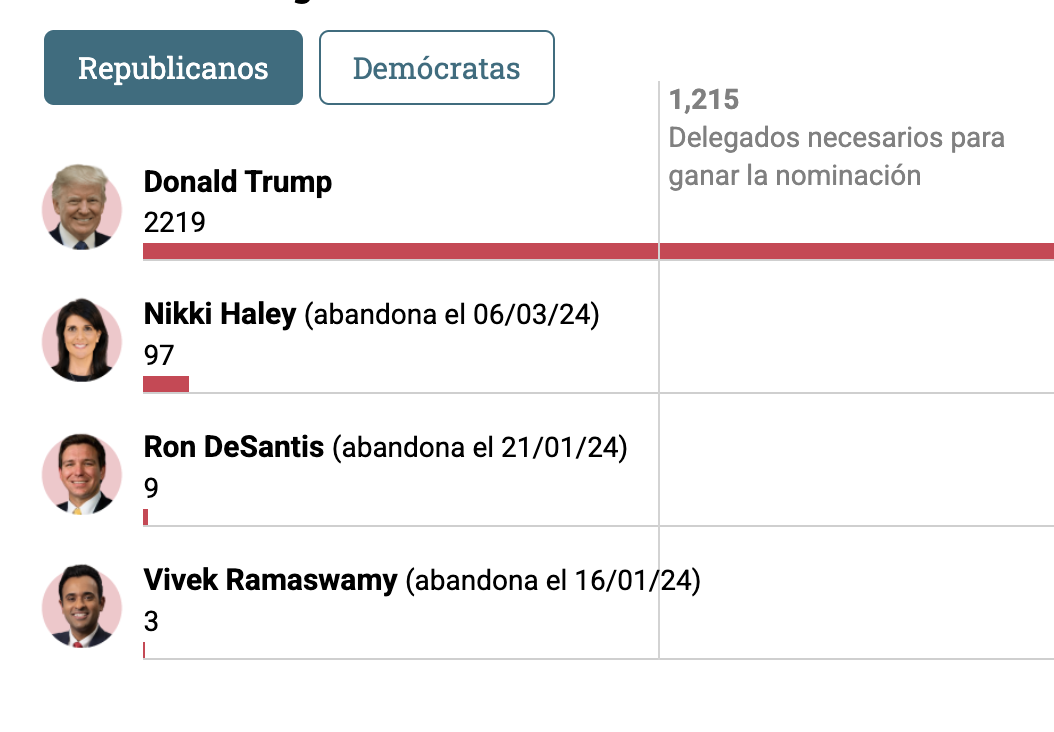
A project to turn policy volatility into clarity: I contributed visual model and interface prototyping, a custom icon set, a standout homepage animation, and data updates as events evolved.
Visual Story • Concept • Data Visualization • Information Design
Tools used

Univision
View project →
My role
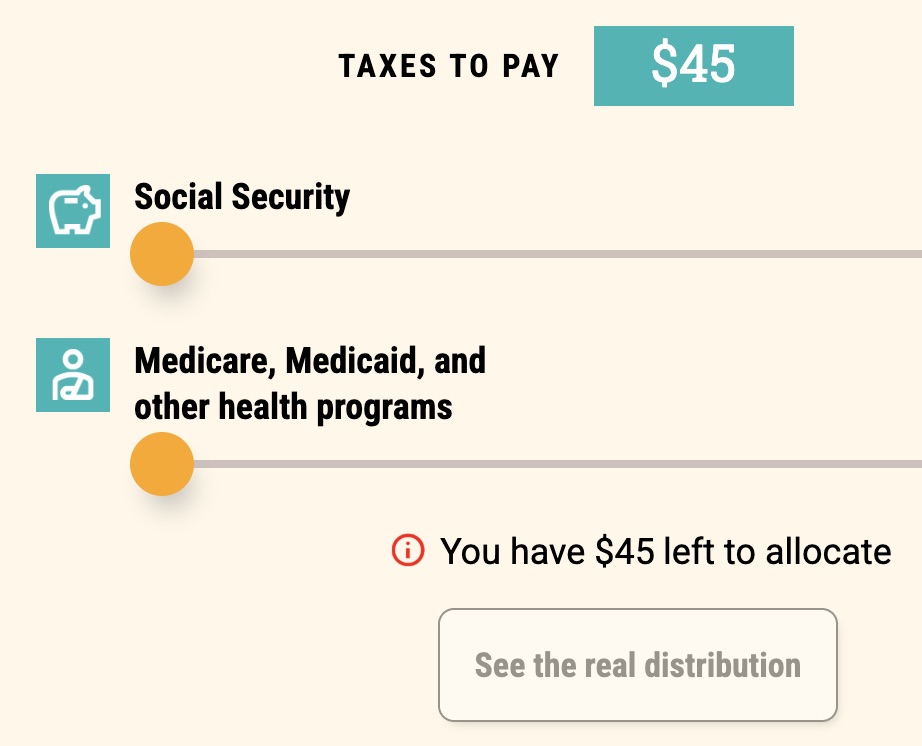
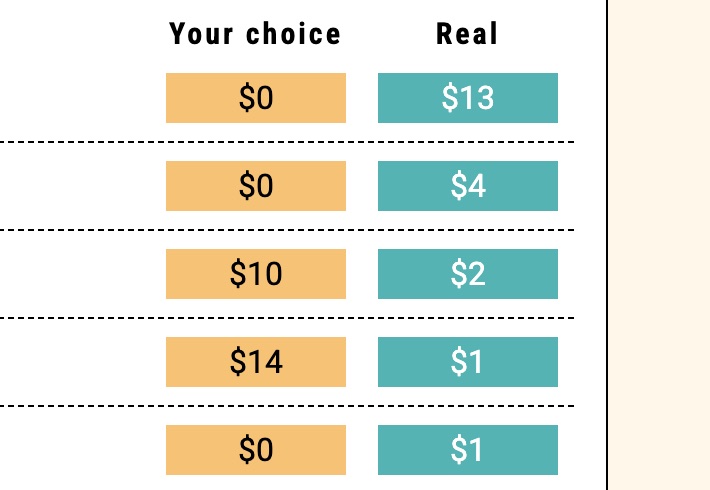
I pitched, co-reported and designed this visual interactive story. My concept: break down a nearly $3 trillion budget into a single $100 bill, then let readers allocate their own dollars before seeing how Congress actually spends them.
Visual Story • Pitch • Concept • Reporting • Graphics • Information Design
Tools used
★ Society for News Design (SND) award

Univision
View project →
My role
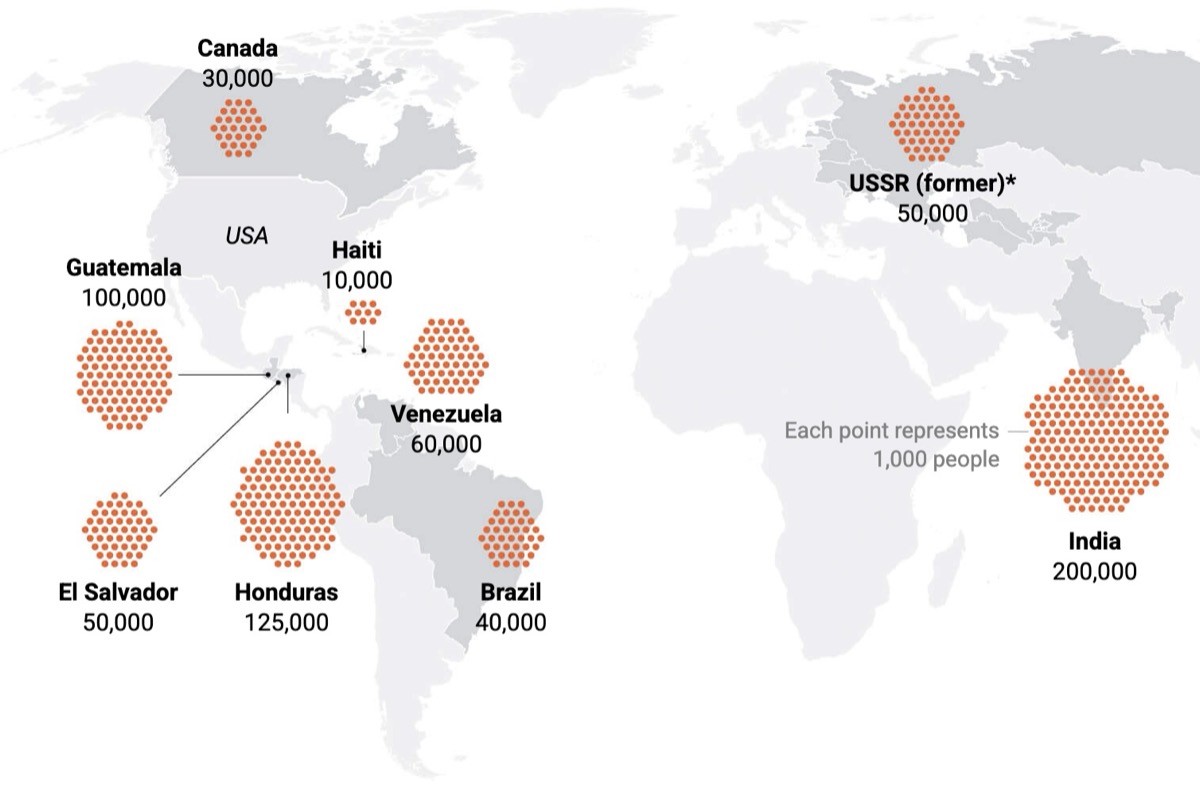
I pitched, co-wrote and designed this data-driven visual story tracking three decades of change in the undocumented immigrant population in the U.S., handling concept, graphics, and animation to make a complex, politically sensitive dataset accessible and compelling.
Visual Story • Pitch • Concept • Writing • Design • Graphics
Tools used

Univision
View project →
My role
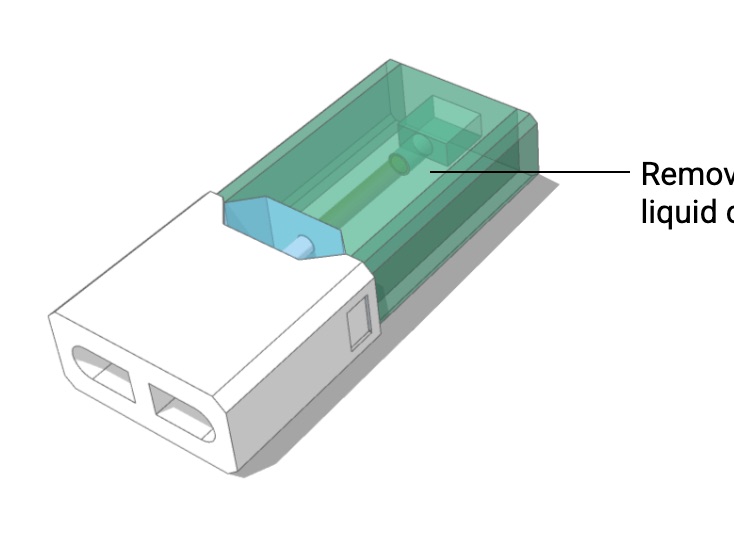
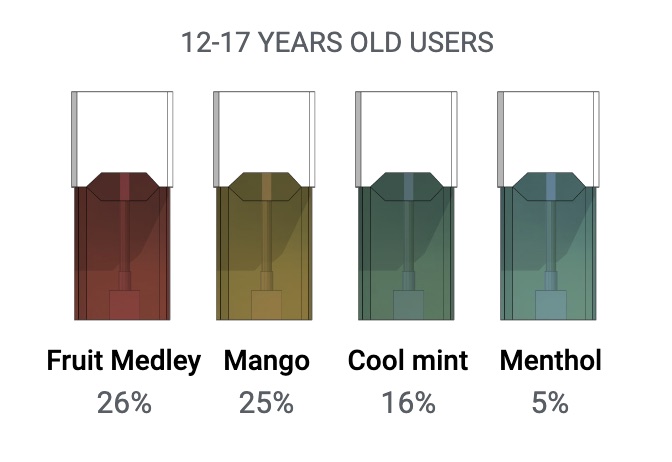
I conceived and designed this visual story on vaping among American youth. The opening was a deliberate creative choice: starting from the sleek, "cool" image the product projects, then using scroll to take the reader inside the device and reveal what it actually contains. I handled research, 3D modeling, and graphics throughout.
Visual Story • Concept • Research • Graphics • 3D
Tools used
★ Society for News Design (SND) award


Univision
View project →
My role
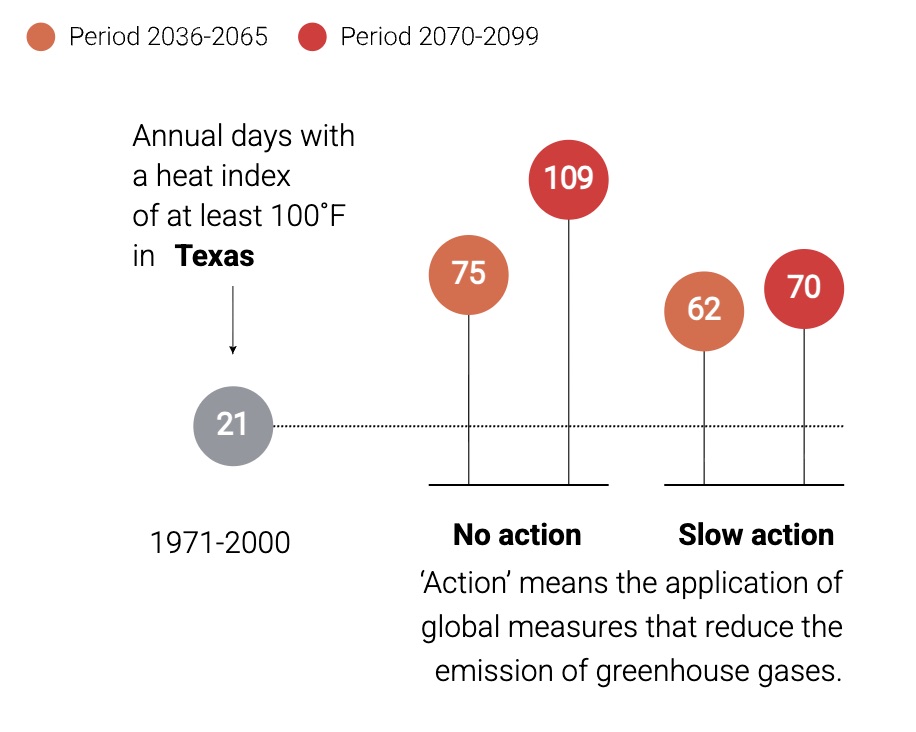
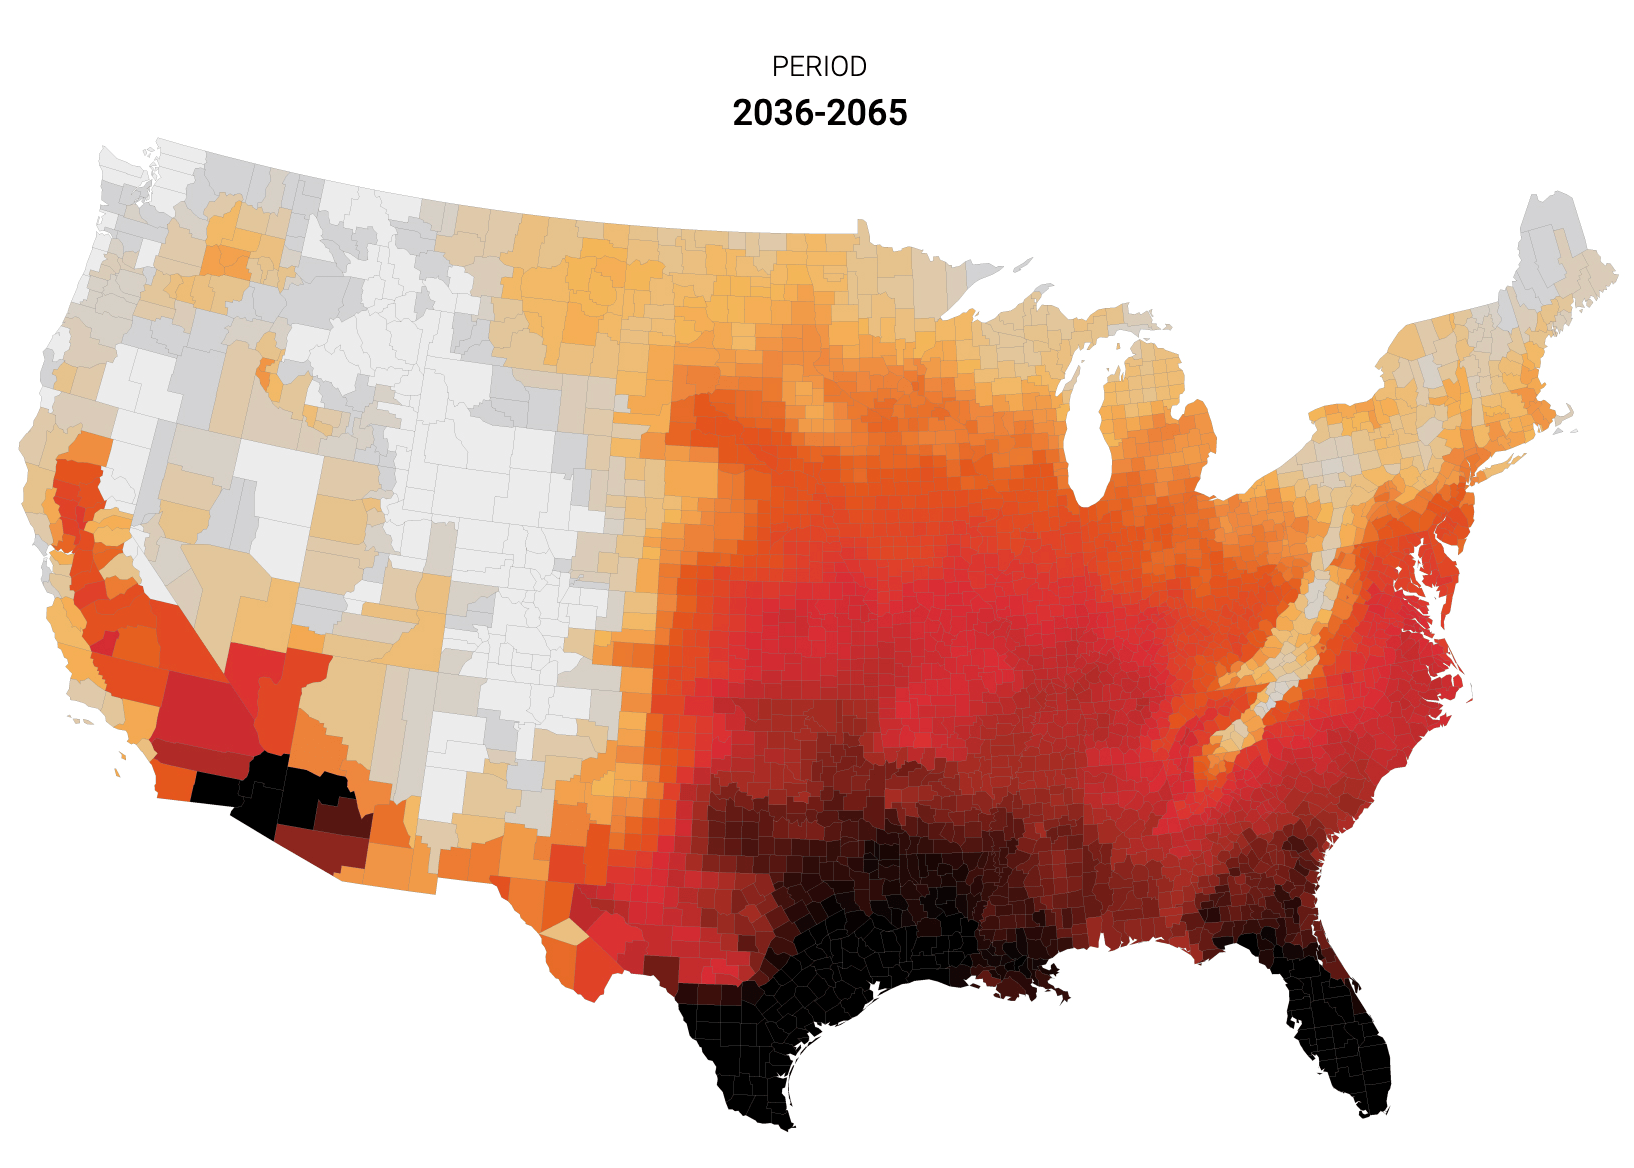
I designed this data-driven visual story on the growing threat of extreme heat in the U.S., with a specific focus on the disproportionate exposure of Hispanics. From the data in a report, I came up with the idea of a scroll experience over the map to visualize how heat exposure would evolve over time, and a small interactive that lets readers check their own local data across different climate action scenarios.
Concept • Data Analysis • Maps • Graphics
Tools used
The Washington Post
View project →
My role
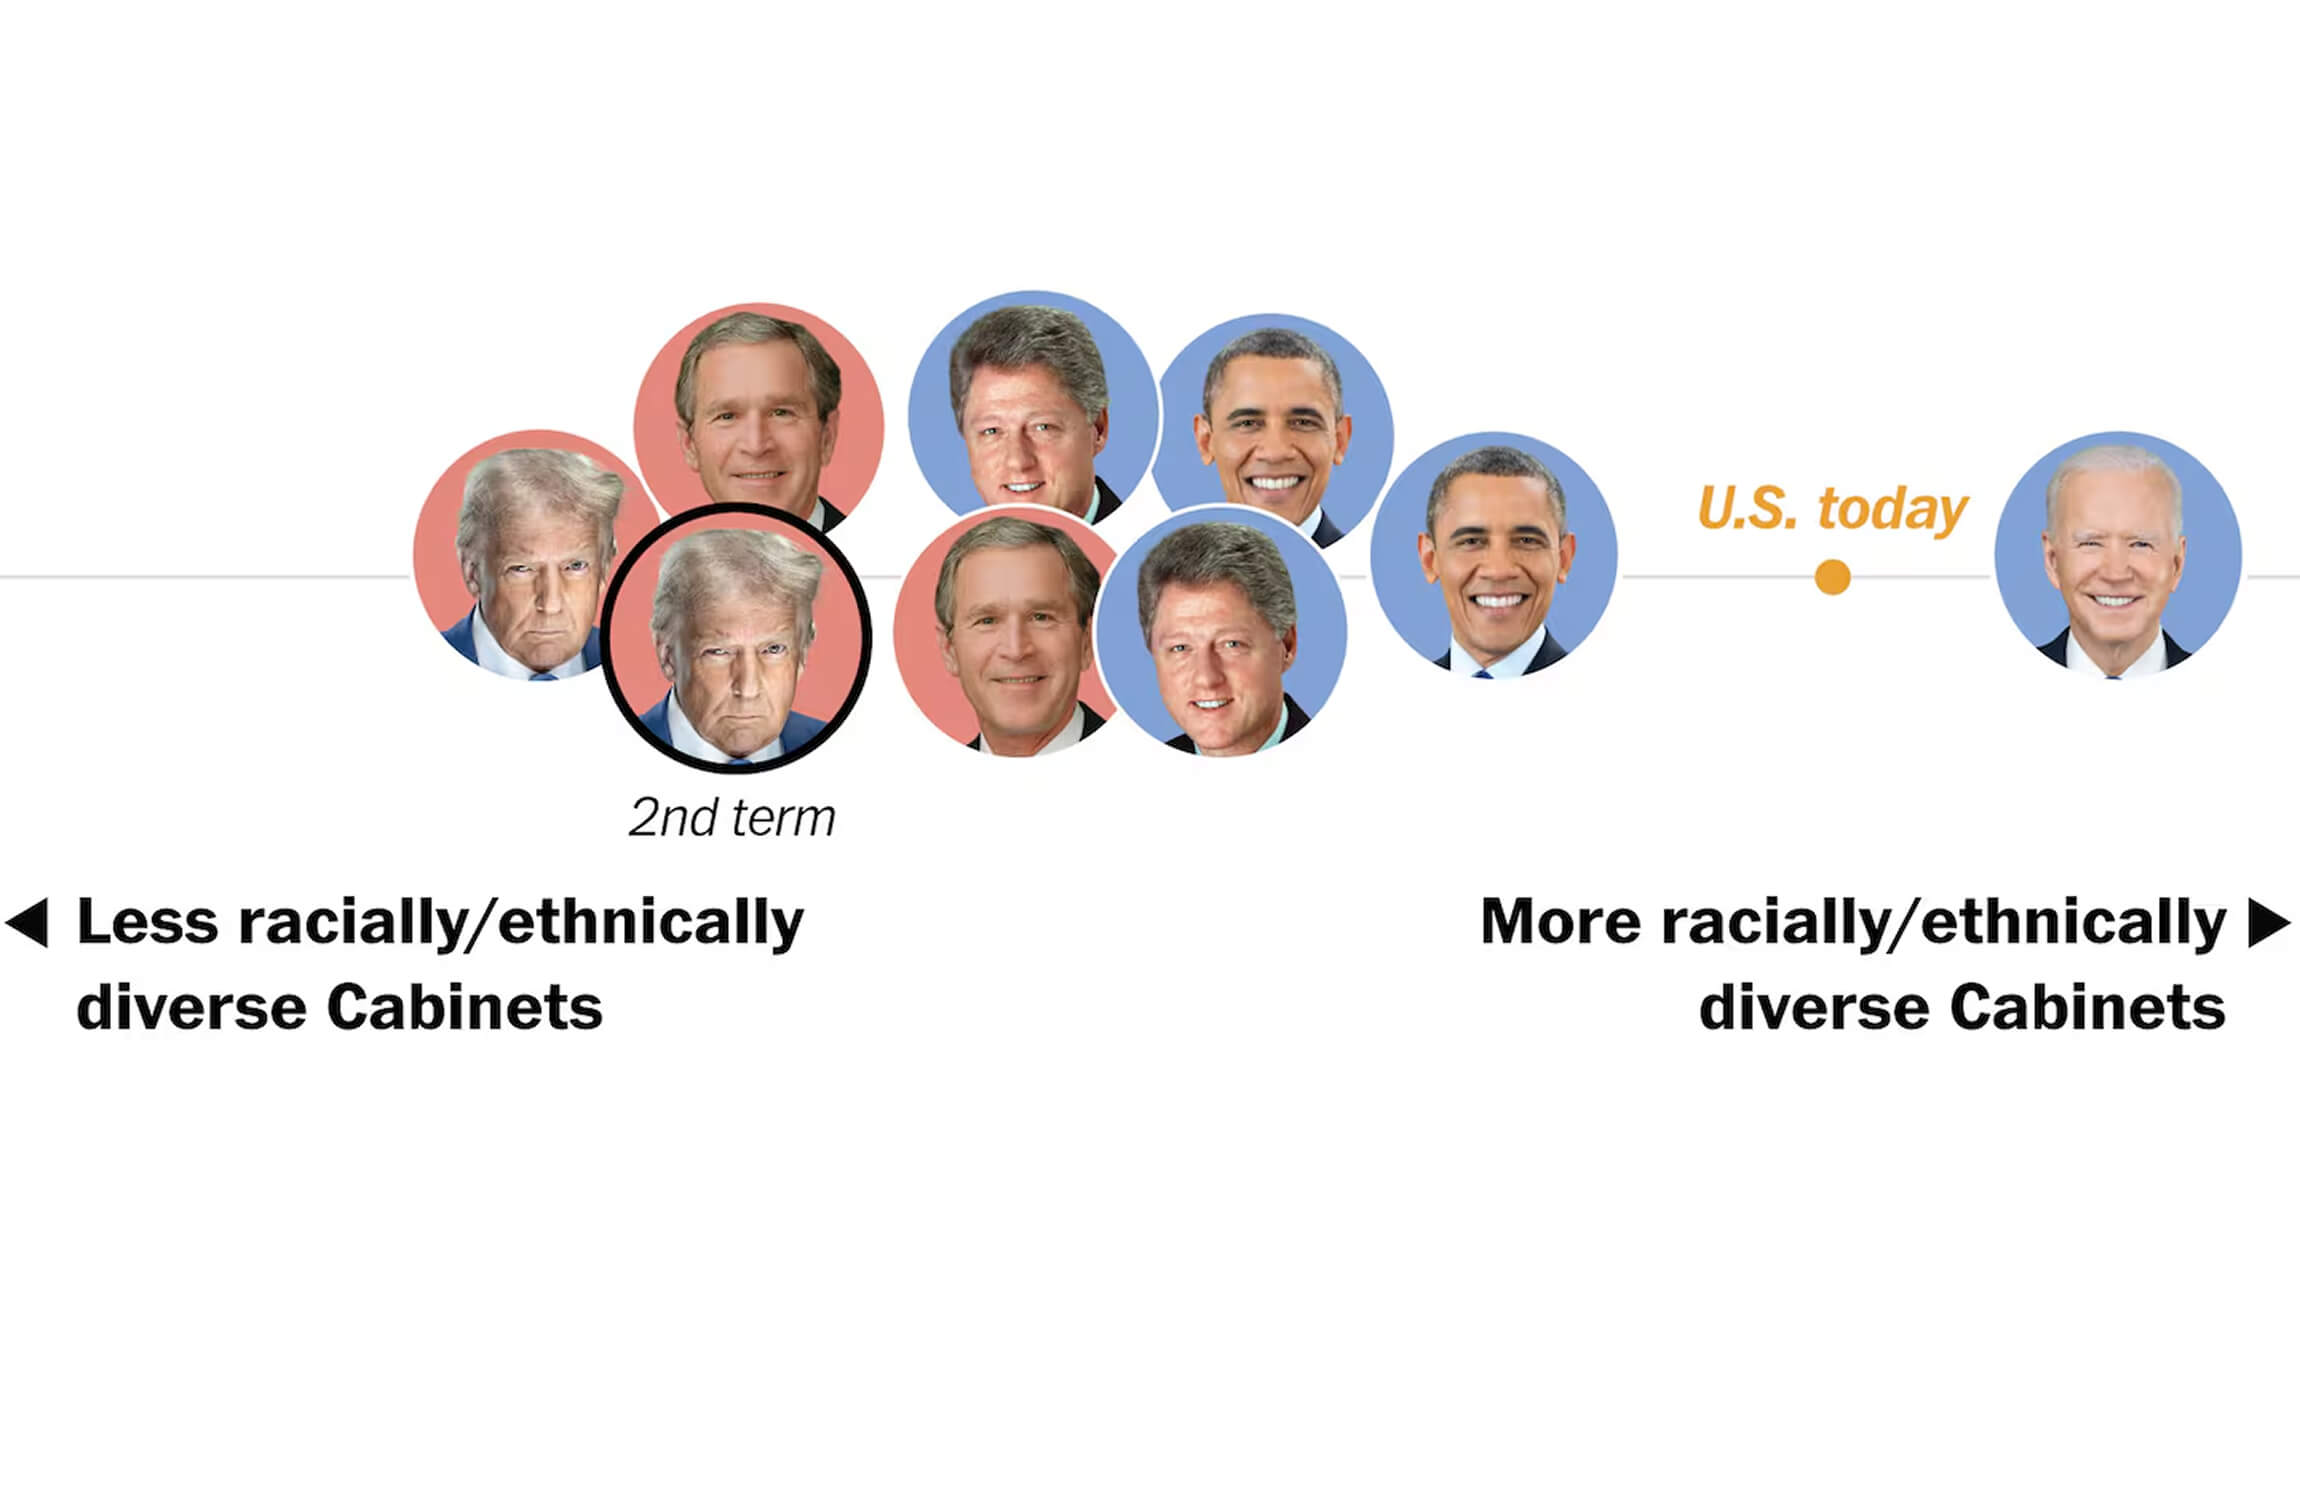
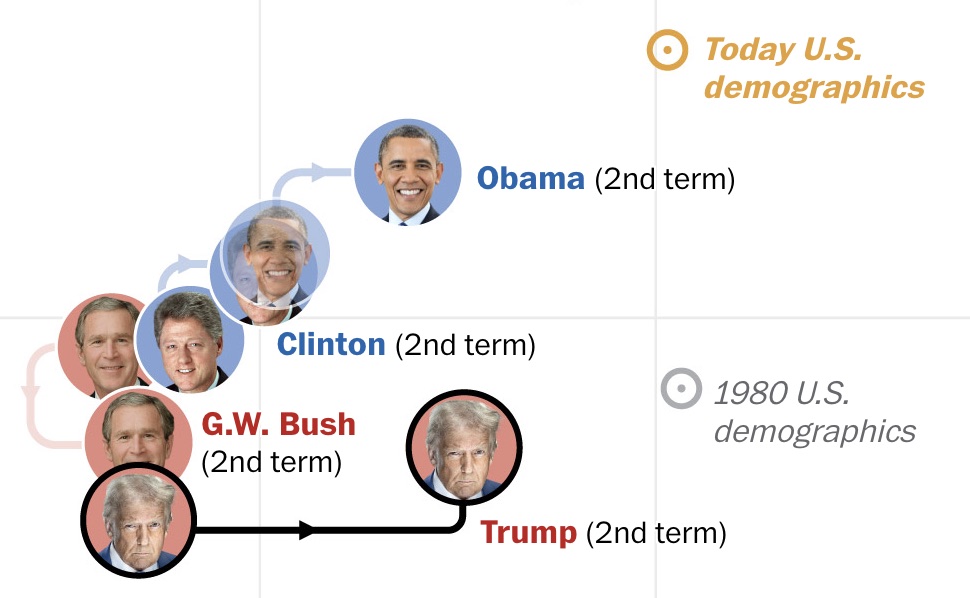
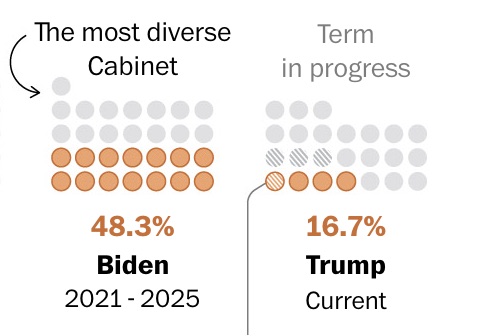
I pitched, reported and wrote this story, consulting with sources and building my own database from scratch, cross-referencing Cabinet records from the Senate, academic centers and presidential archives. The rigorous verification process covered every Cabinet-level position across administrations before I analyzed and visualized the results.
Visual Story • Pitch • Concept • Reporting • Writing • Data Analysis • Graphics
Tools used
The Washington Post
View project →
My role
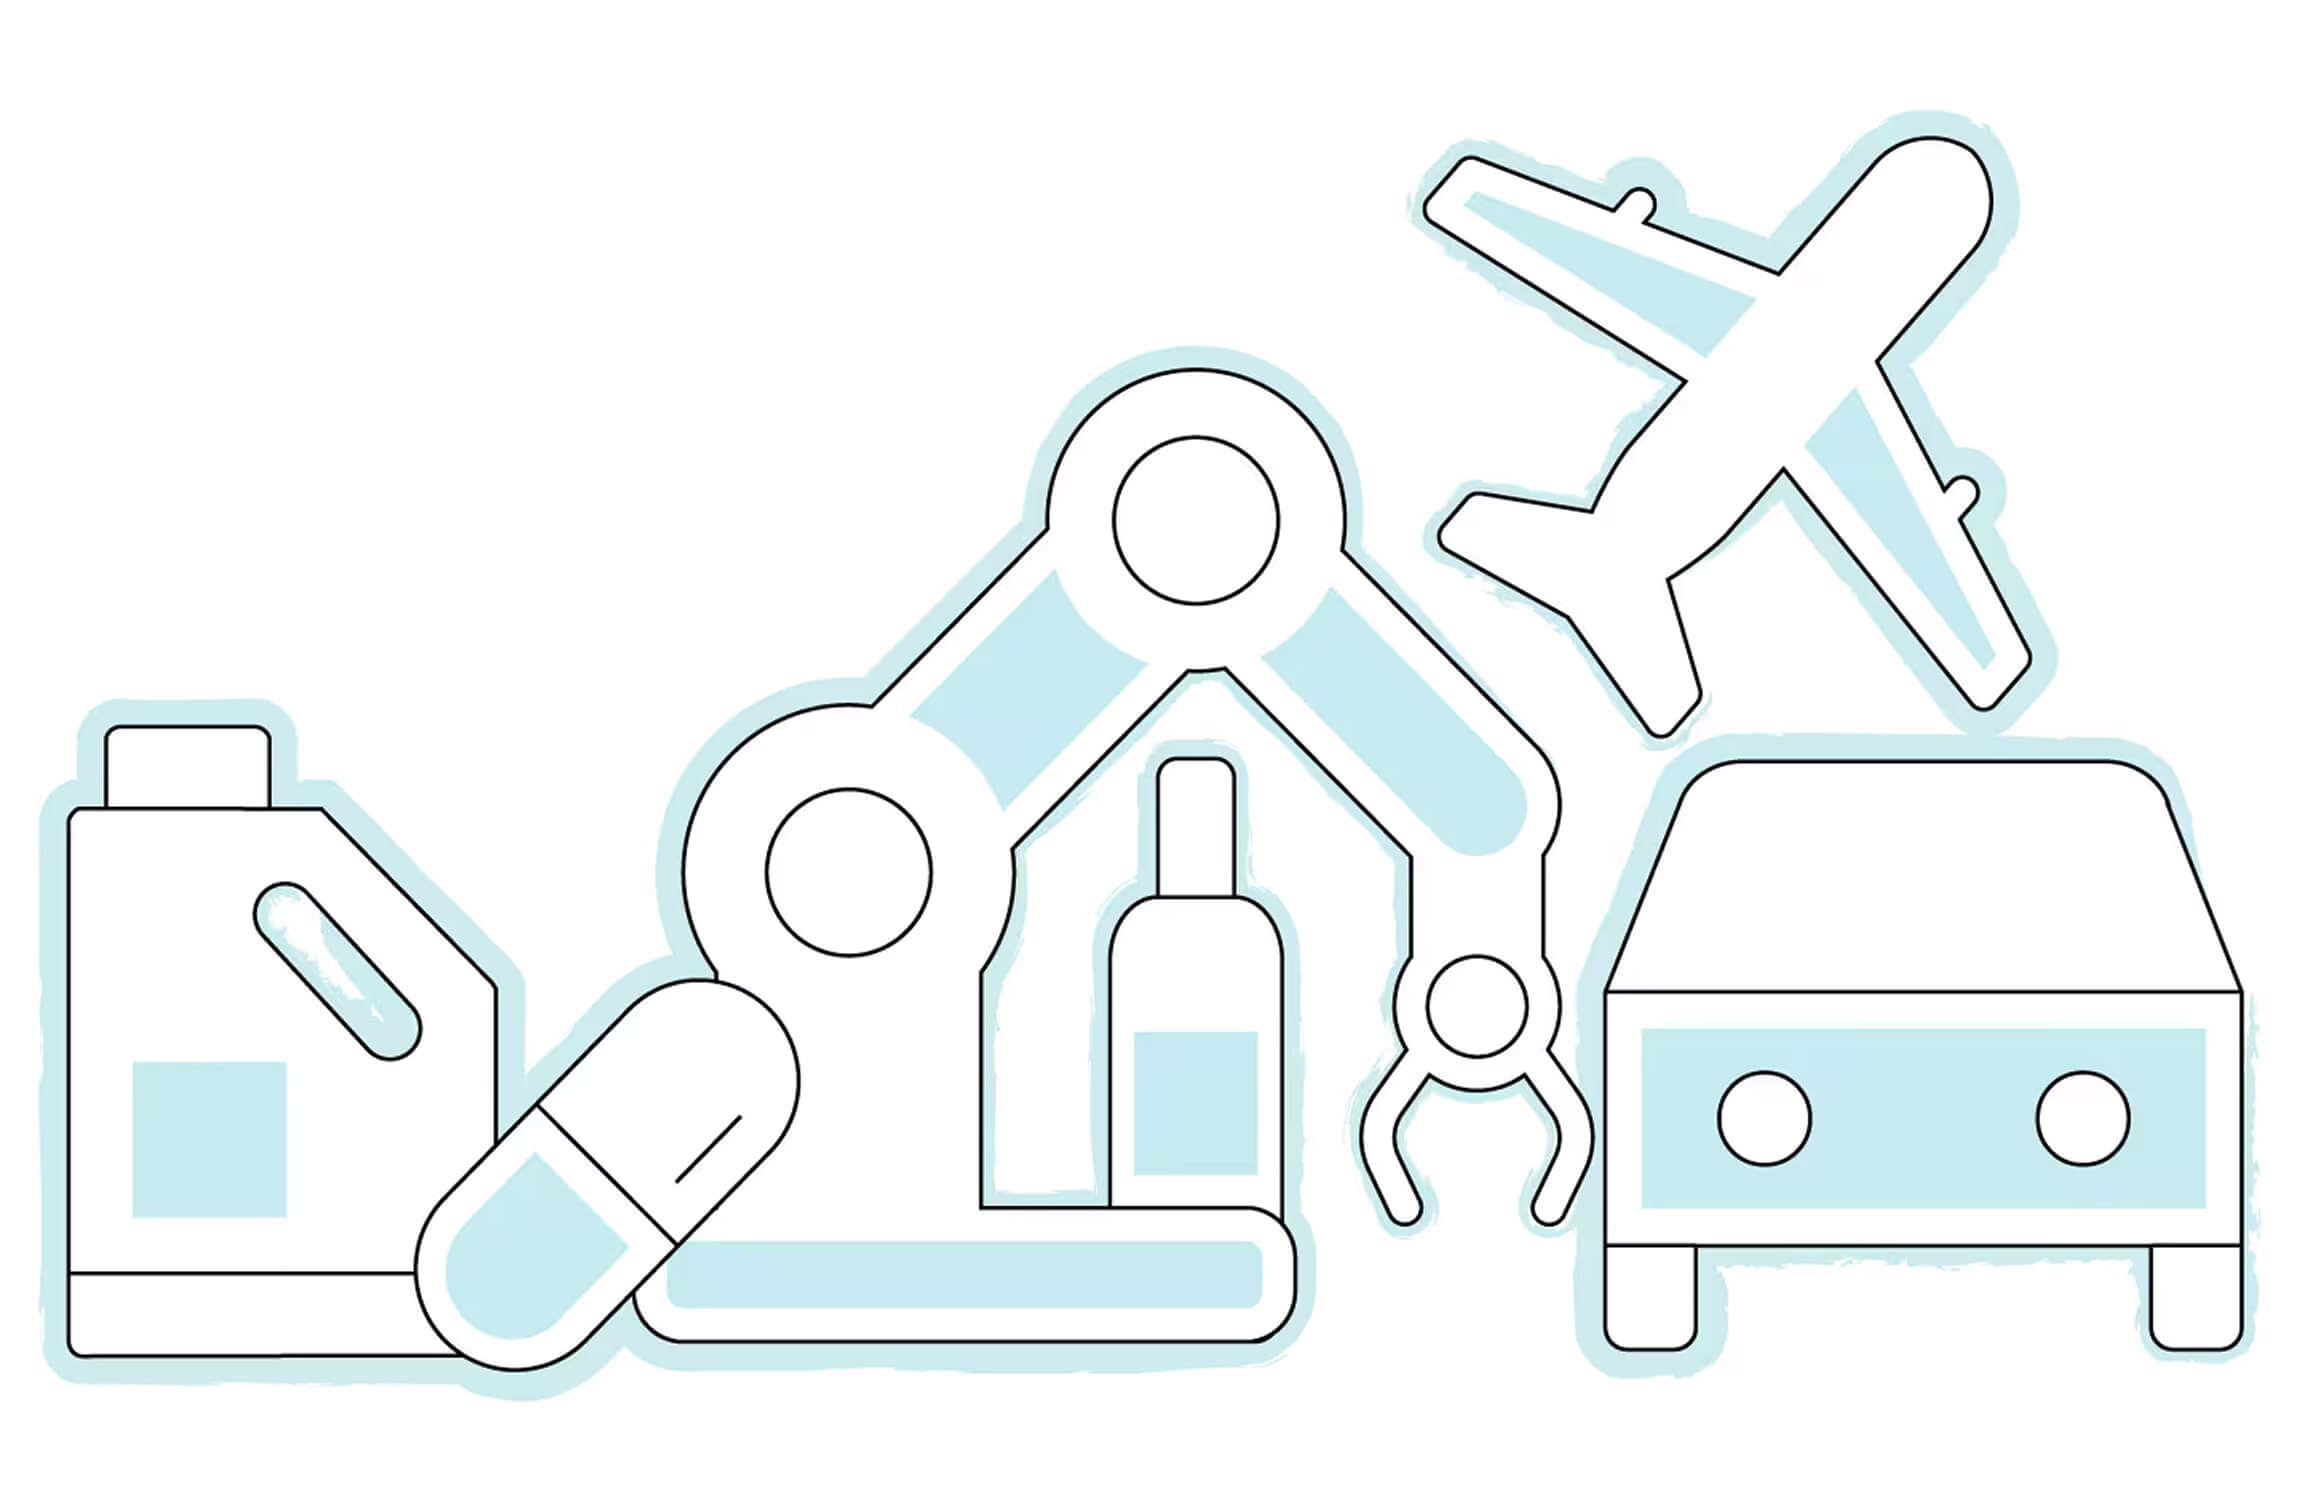
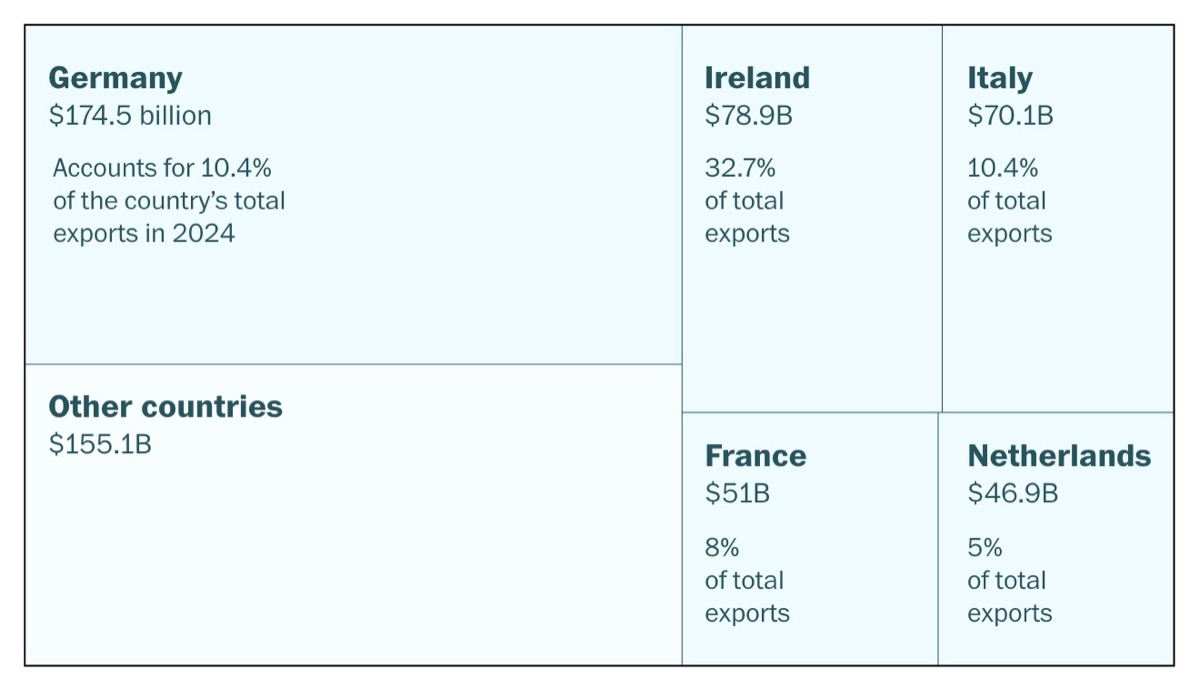
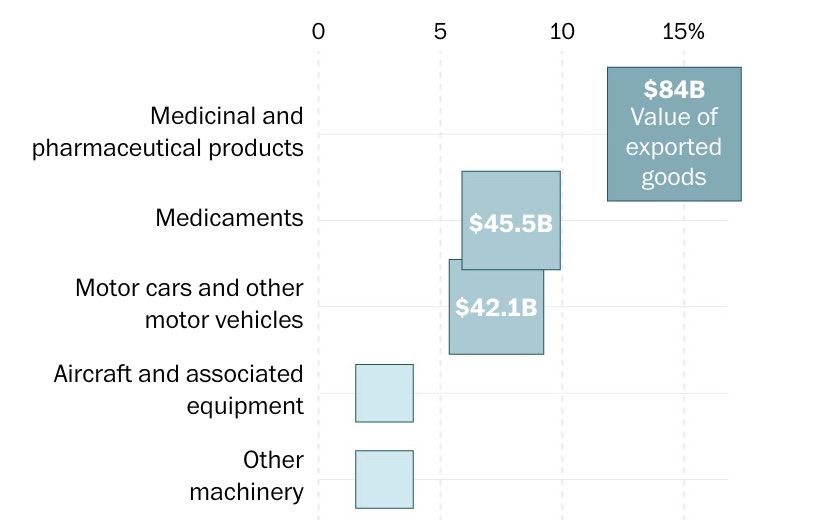
I worked on this story gathering and analyzing the data, building graphics that clarified the scope of Trump’s tariff policy on E.U. goods, the industries most at stake, and the impact on U.S. importers and consumers.
Visual Story • Graphics • Data Visualization
Tools used
The Washington Post
View project →
My role
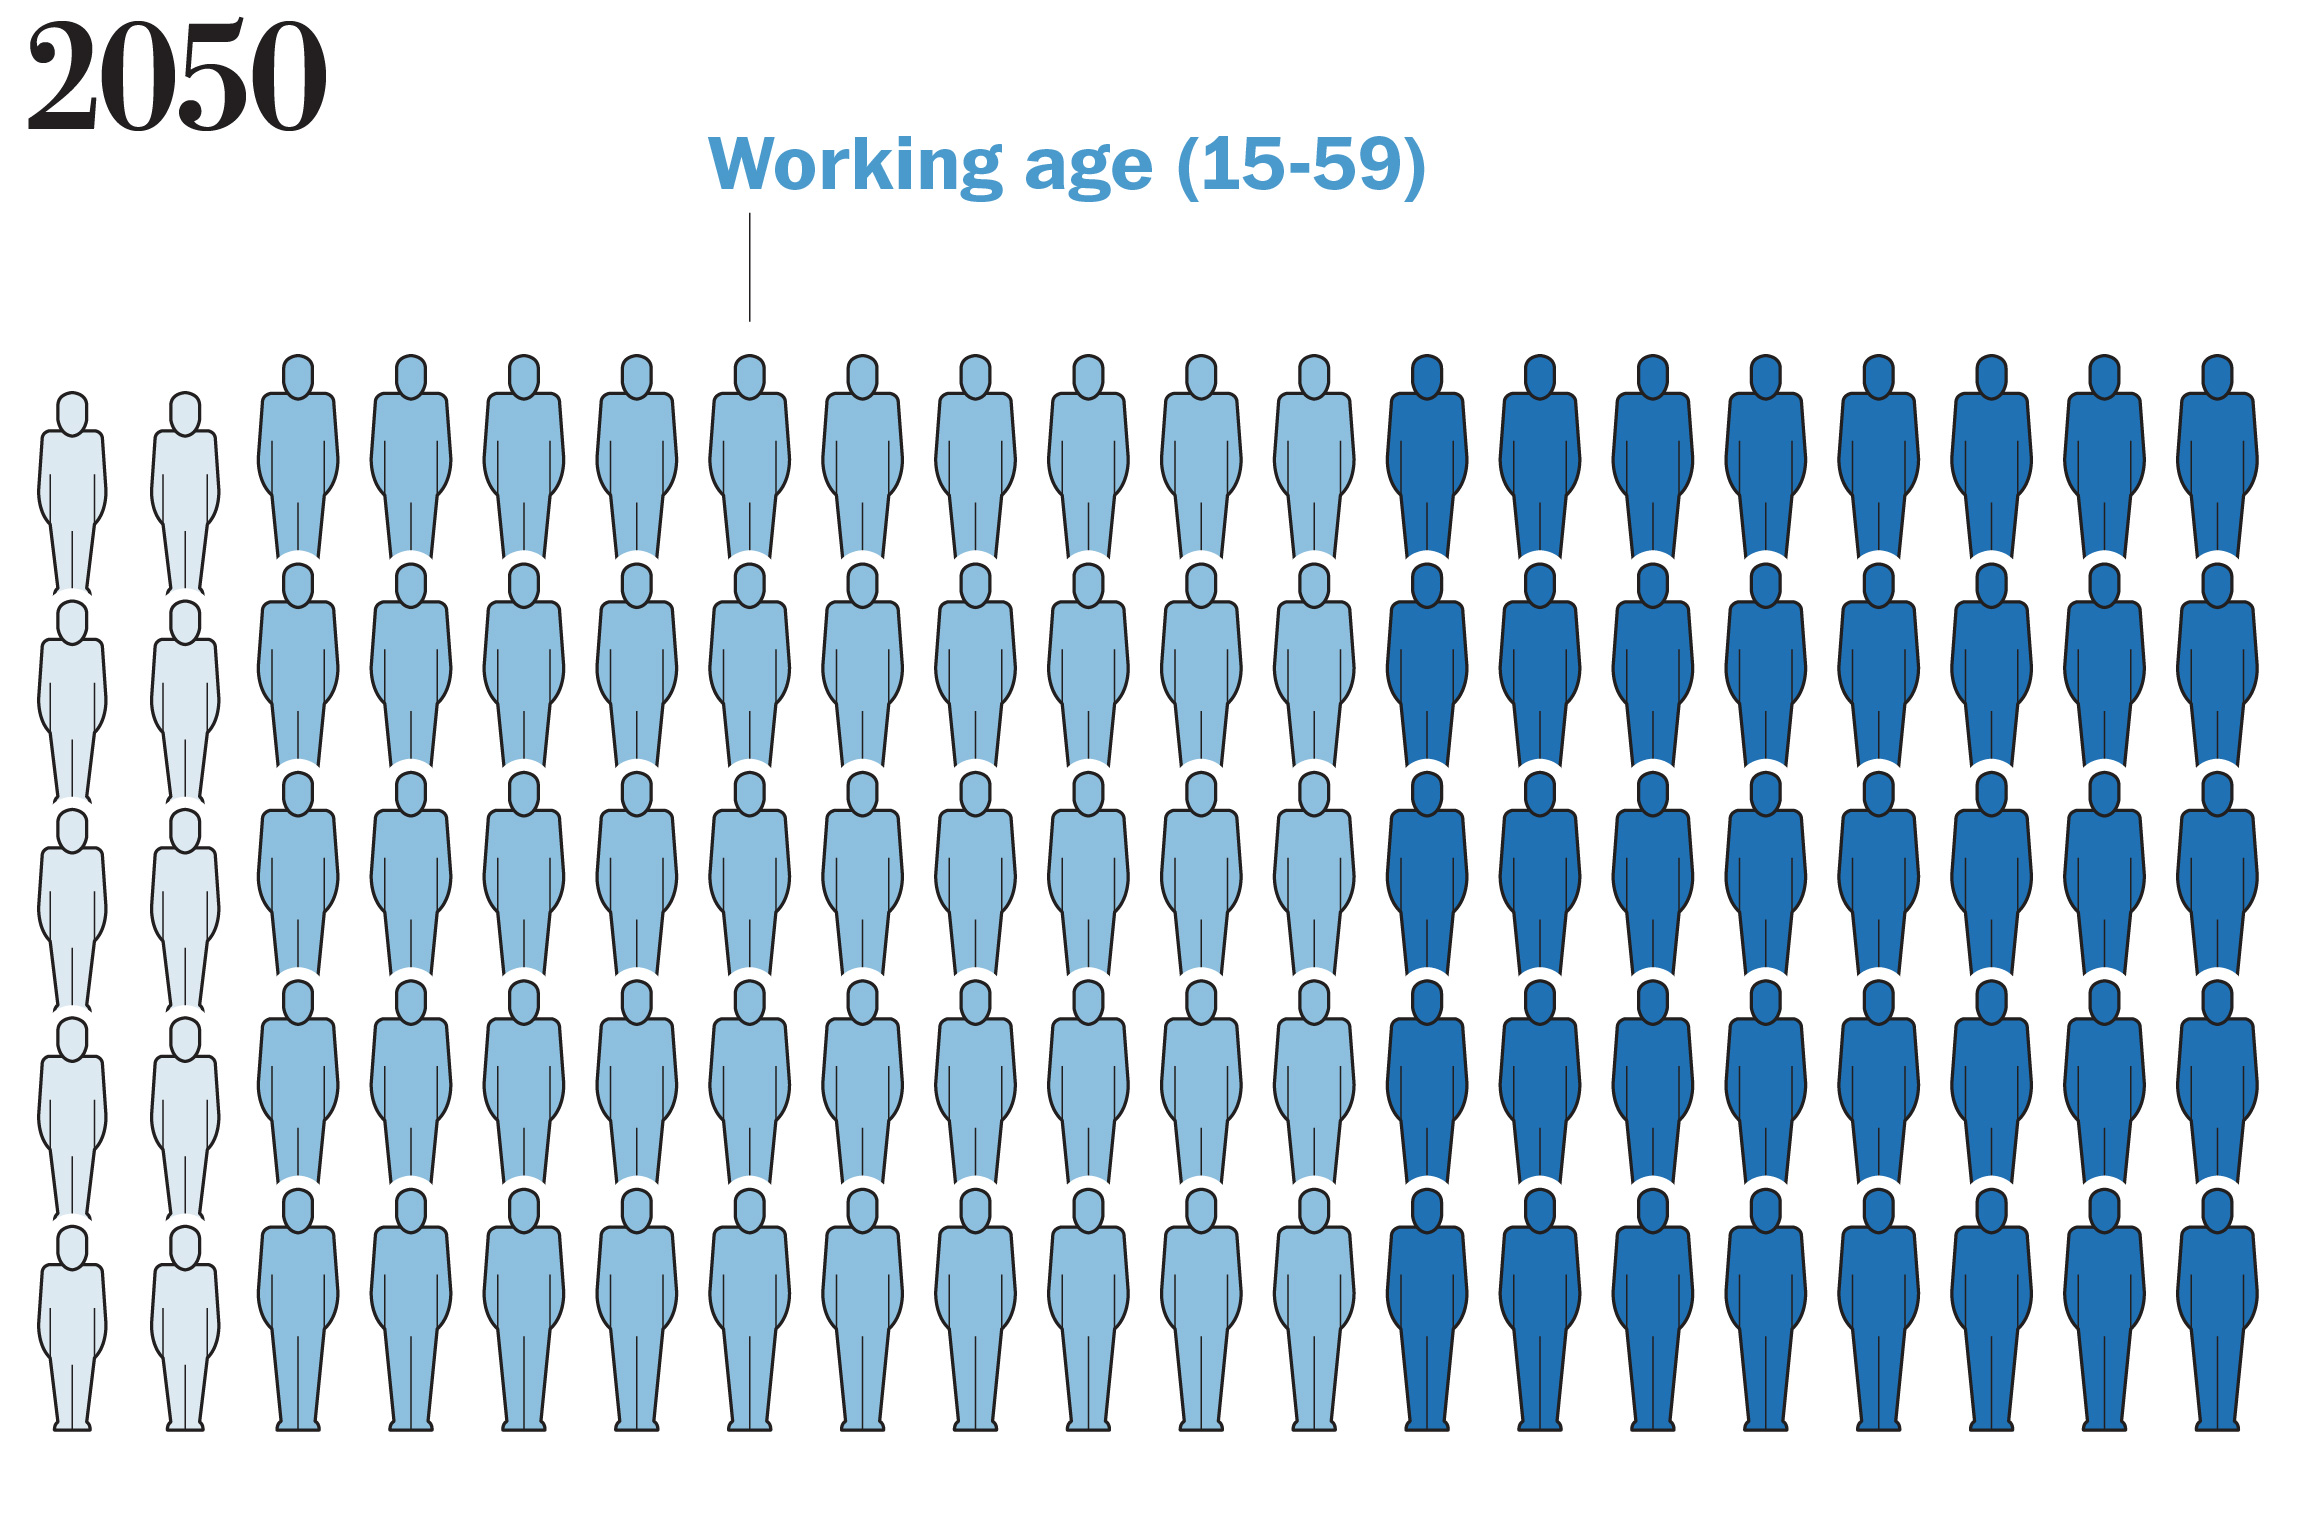
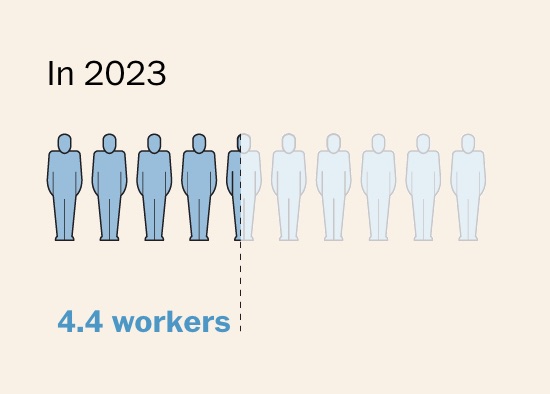
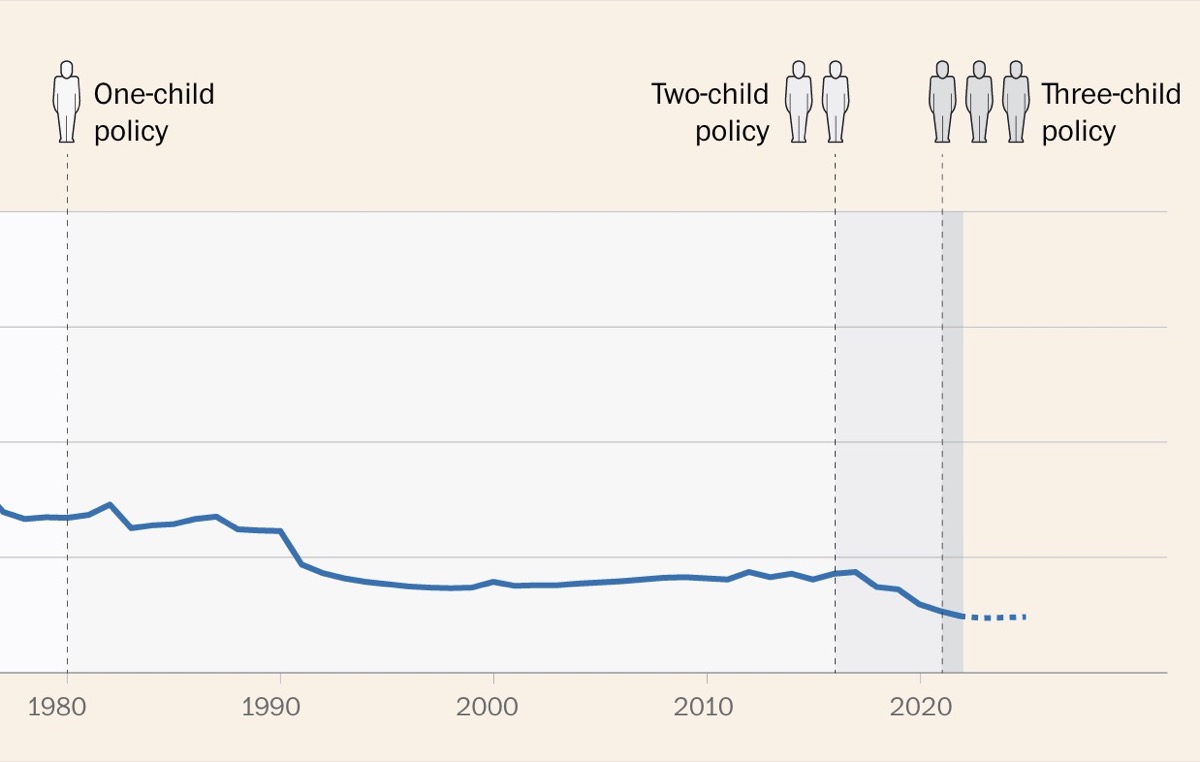
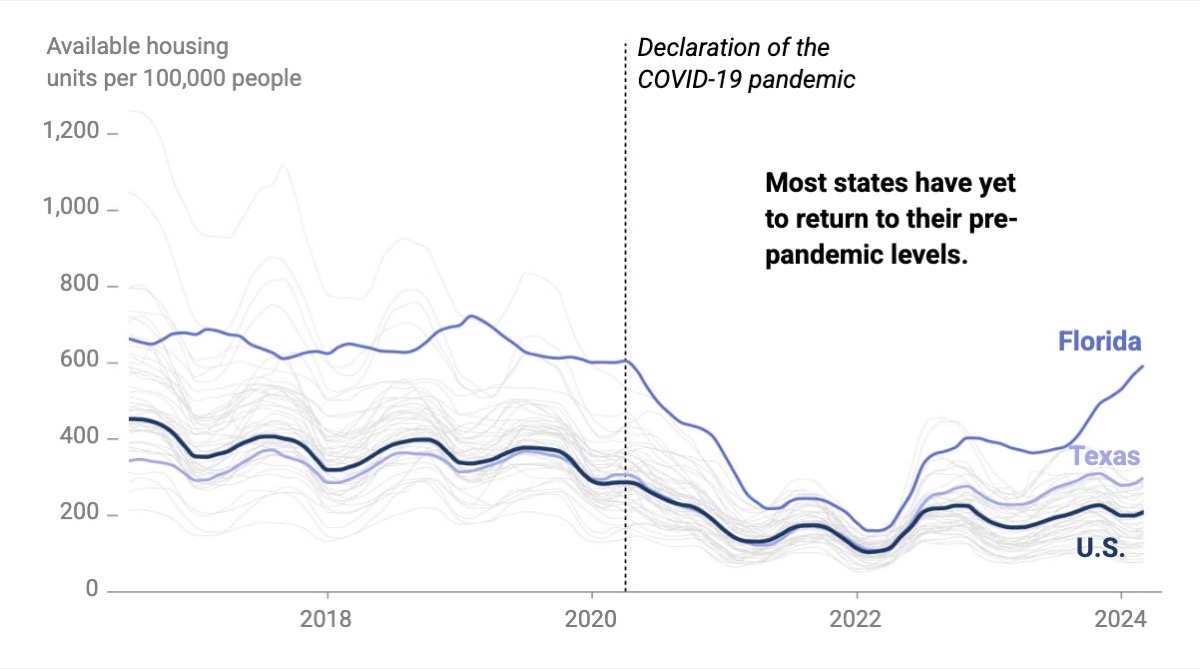
I created an original scrollytelling narrative structure to visualize a population decline of historic proportions, handling data search, analysis, concept, graphics, and information design.
Visual Story • Concept • Data Analysis • Graphics • Information Design
Tools used
The Washington Post
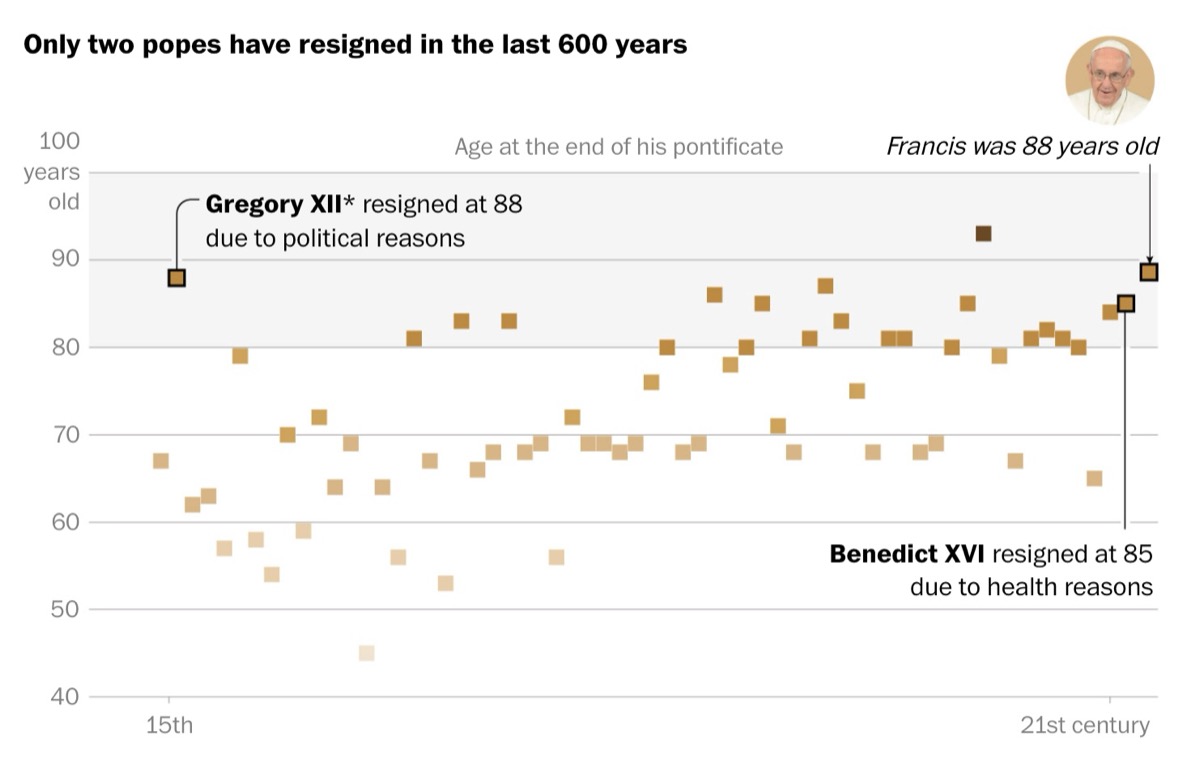
Pope election coverage
My role
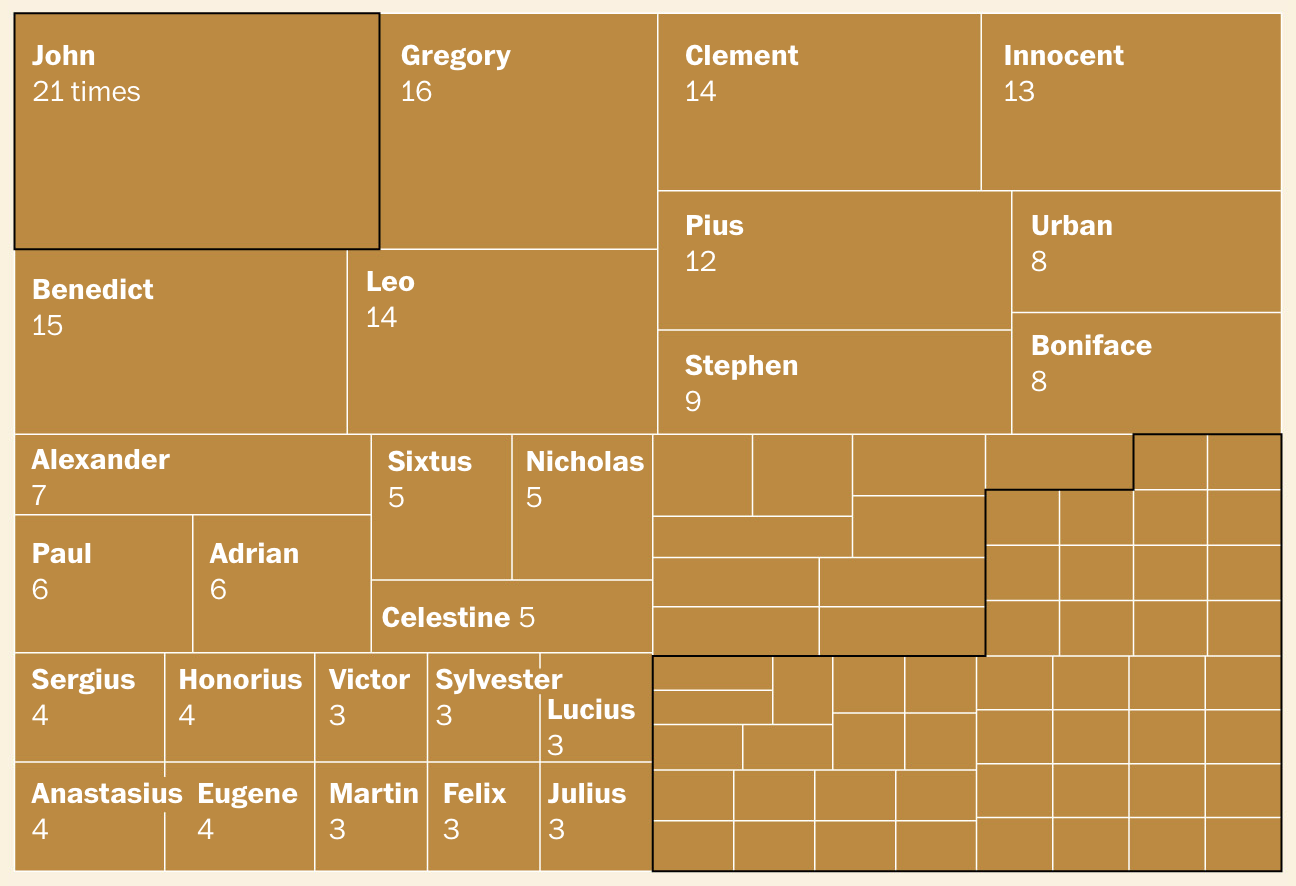
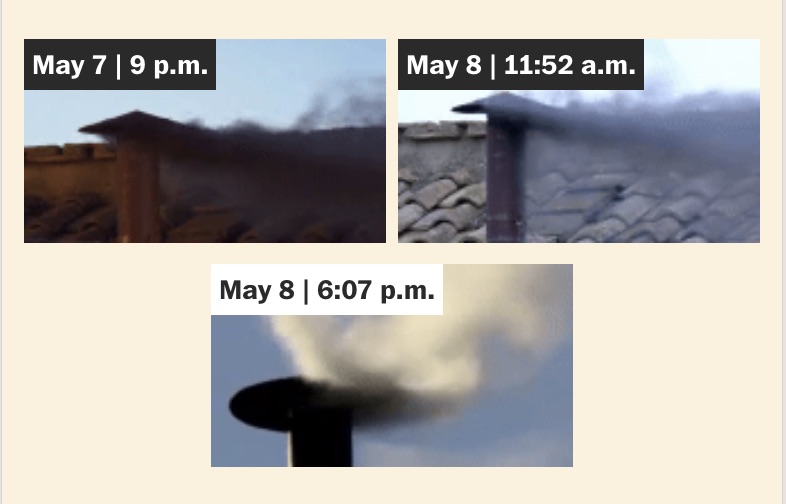
I collaborated on the interface design, proposing a grid of GIFs to track the election through the smoke signals, an original visual system that offered instant clarity. In the lead-up to the conclave, I also reported and wrote a data story on where Francis stands among modern predecessors.
Visual Story • Reporting • Writing • Graphics • Data Visualization
Tools used

Univision
View project →
My role
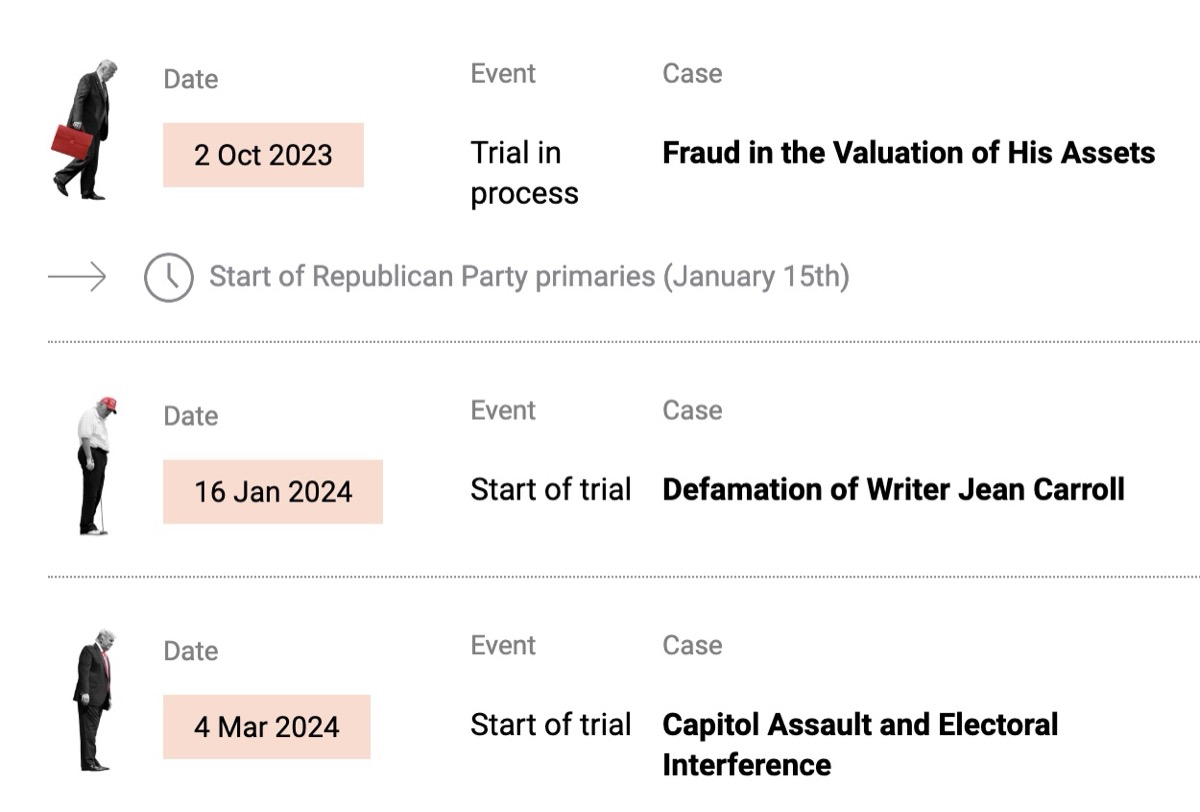
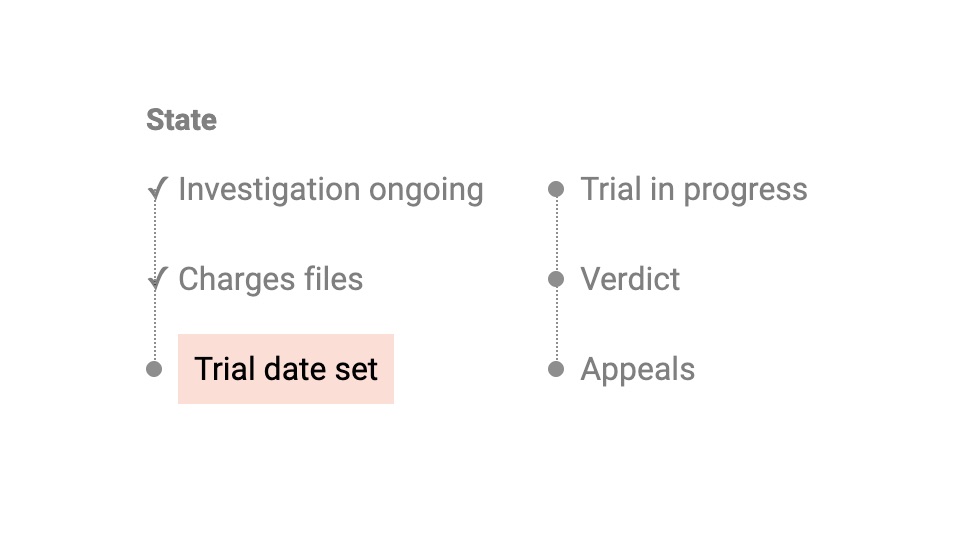
I proposed this visual story from a unique angle: differentiating Trump’s legal exposure across his three roles as president, businessman, and citizen. I designed the information architecture and an interactive agenda that surfaced upcoming events and removed them as they passed.
Pitch • Concept • Information Design • Visual Storytelling
Tools used
★ Society for News Design (SND) award

Univision
View project →
My role
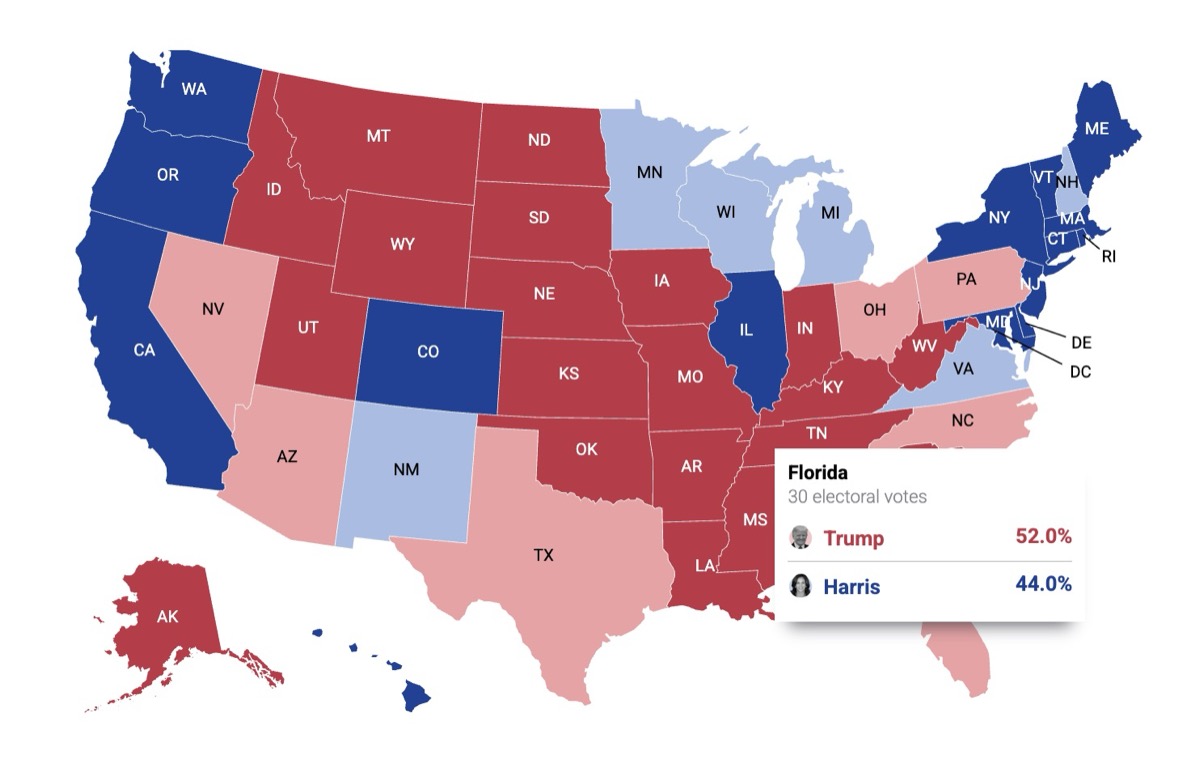
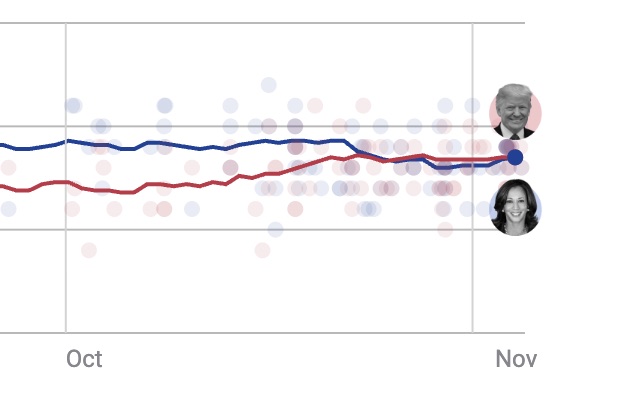
I wrote this story and designed its interface, putting Harris and Trump face to face in a distinctive layout that brought polling data to life through its protagonists, using each party’s political colors and a live countdown to election day to give the data a real-time pulse.
Visual Story • Concept • Writing • Design
Tools used

Univision
View project →
My role
I proposed this breaking news story and outlined the narrative structure of an event that unfolded overnight in the U.S., working on the graphics to have it published by the American morning.
Visual Story • Concept • Reporting • Graphics
Tools used

Univision
View project →
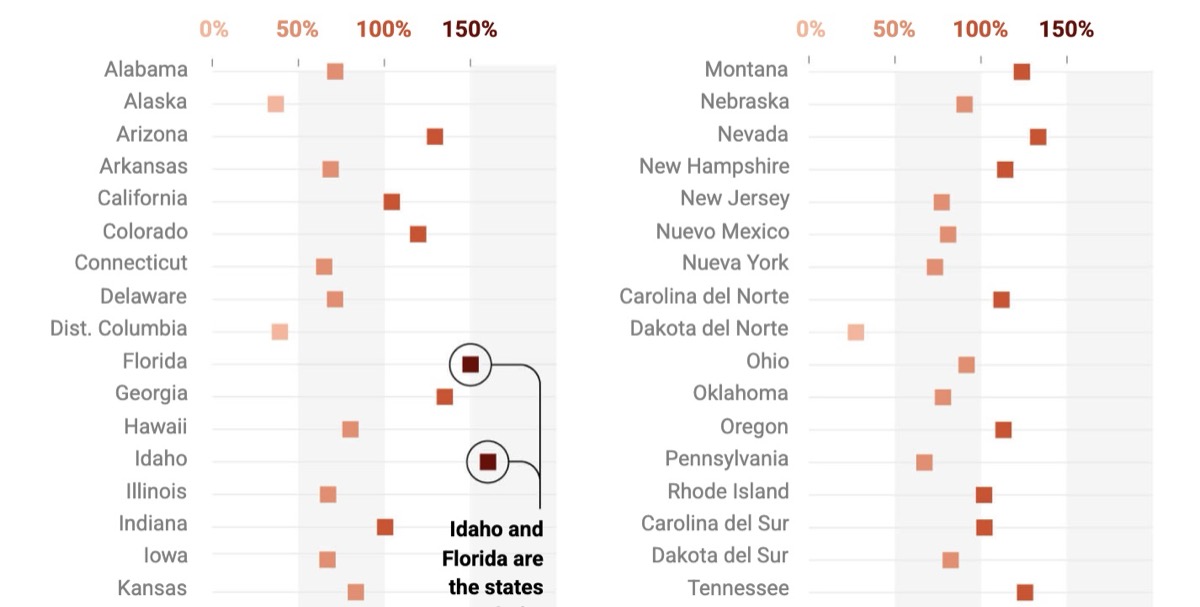
The value of homes in the U.S. has skyrocketed in recent years, triggering an unprecedented housing appreciation, where demand far exceeds the available supply
Visual Story • Pitch • Concept • Reporting • Writing • Graphics • Design
Tools used
Univision
View project →
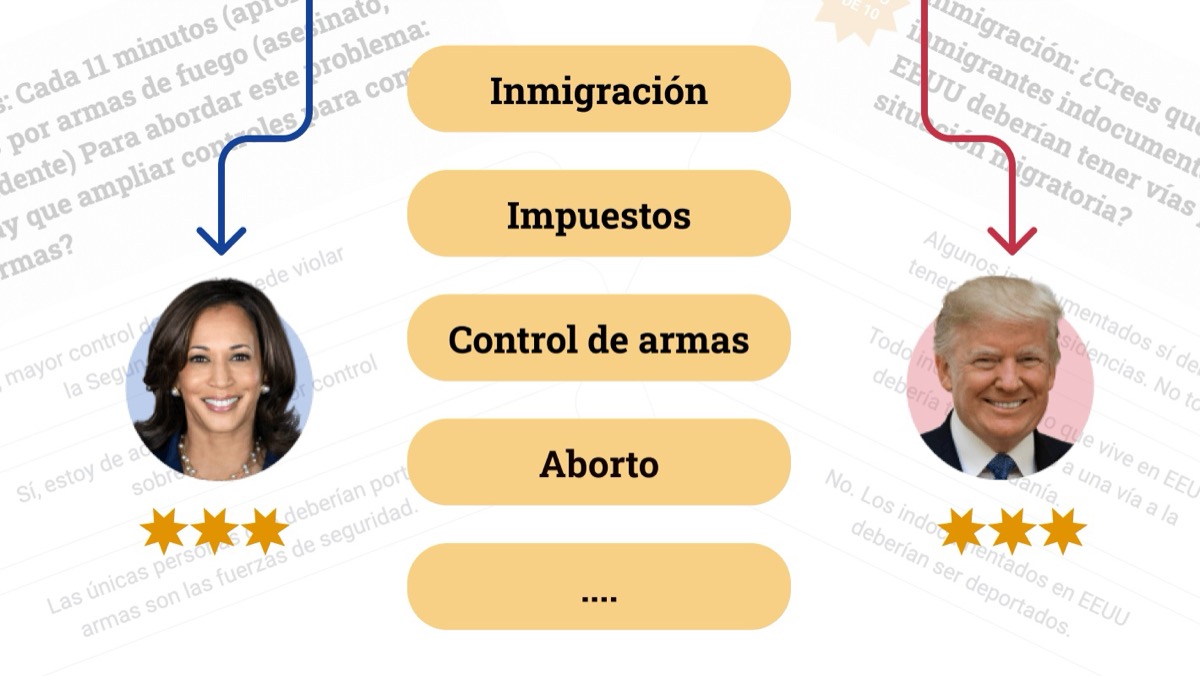
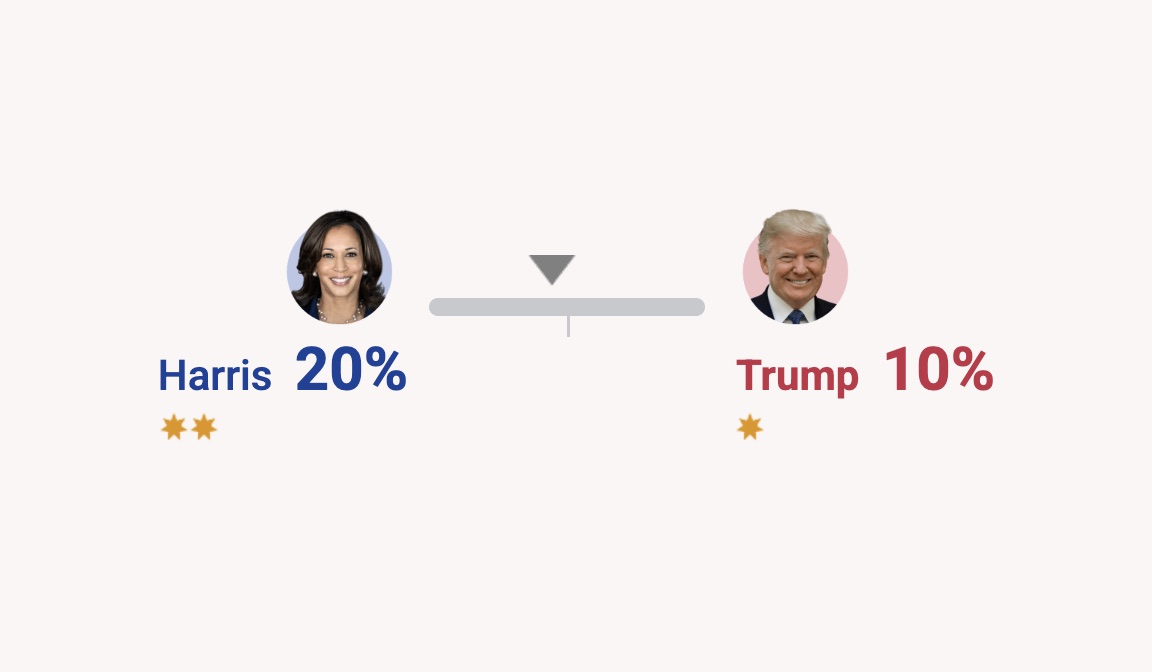
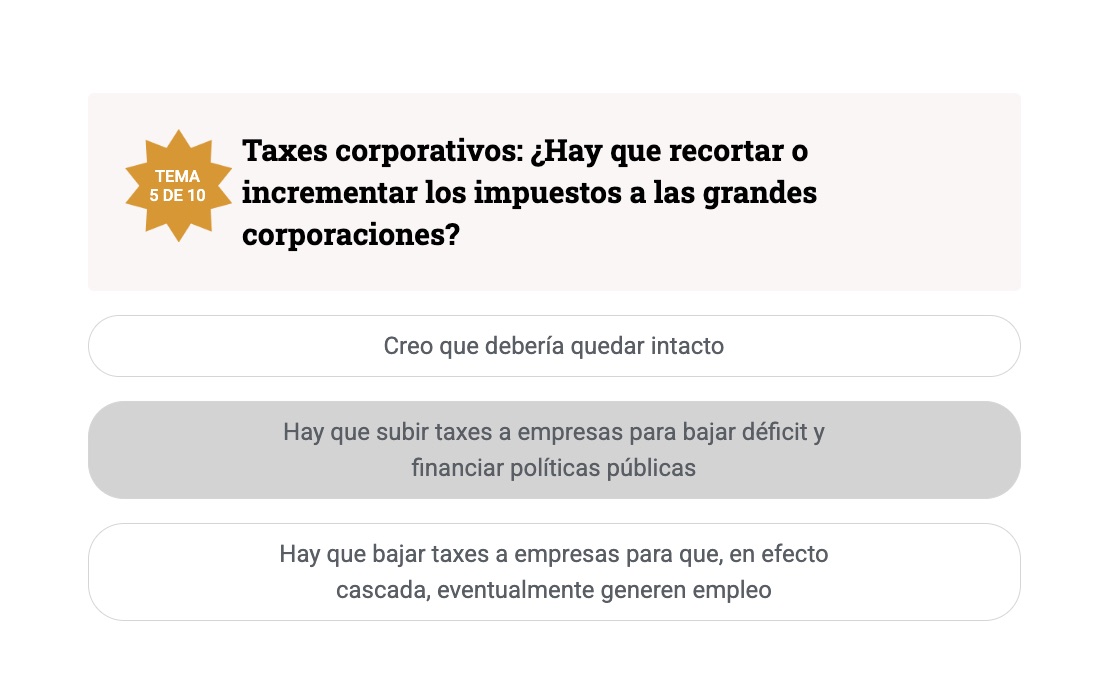
You might be surprised by the result of this mini-survey: compare your opinions with those of Kamala Harris and Donald Trump to see which one aligns with you more
Concept • Information Design • UX
Tools used

Univision
View project →
Aerial images depict the effects of Israeli airstrikes on buildings in the Gaza Strip, providing a before-and-after view of the situation
Visual Story • Pitch • Concept • Maps • Reporting
Tools used
Univision
View project →
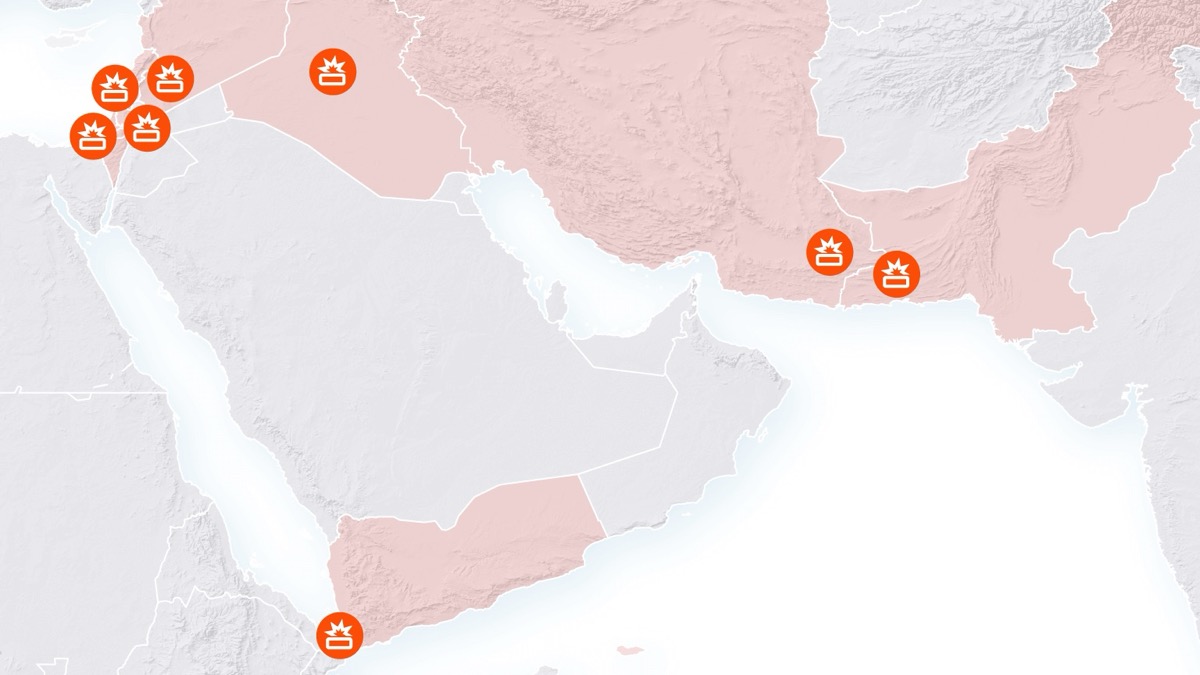
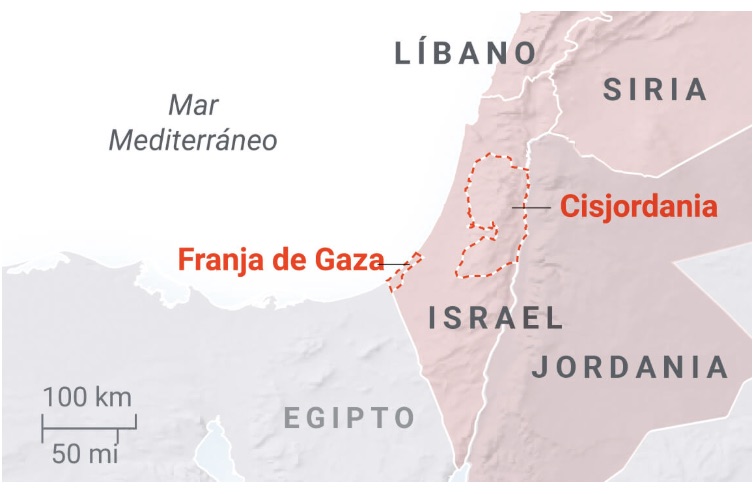
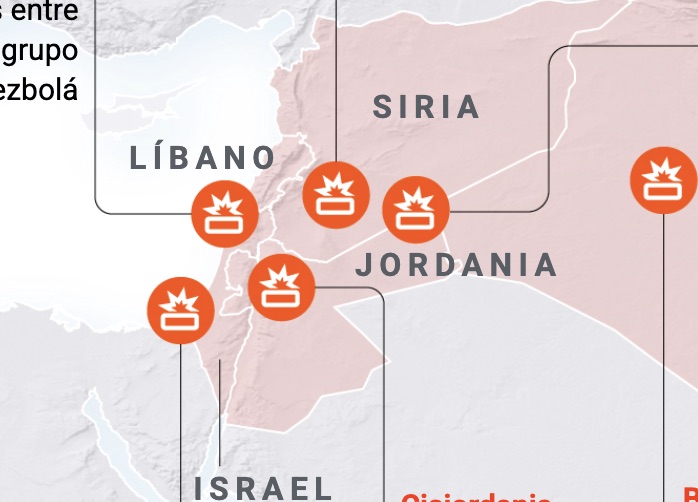
The war between Israel and the Palestinian Islamist group Hamas in the Gaza Strip, with more than 24,000 dead, Israelis kidnapped, and countless material damages, has unleashed old and new tensions throughout the region
Visual Story • Concept • Maps
Tools used
Univision
View project →
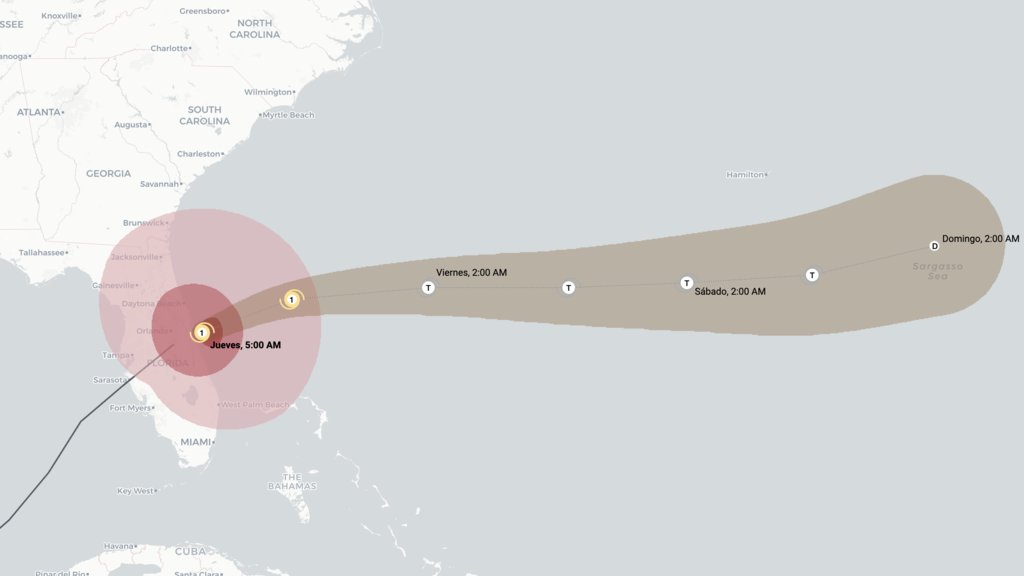
The storm crossed Florida after making landfall last night near Siesta Key as a category 3 hurricane.
Concept • Information Design • Reporting • Writing
Tools used

Univision
View project →
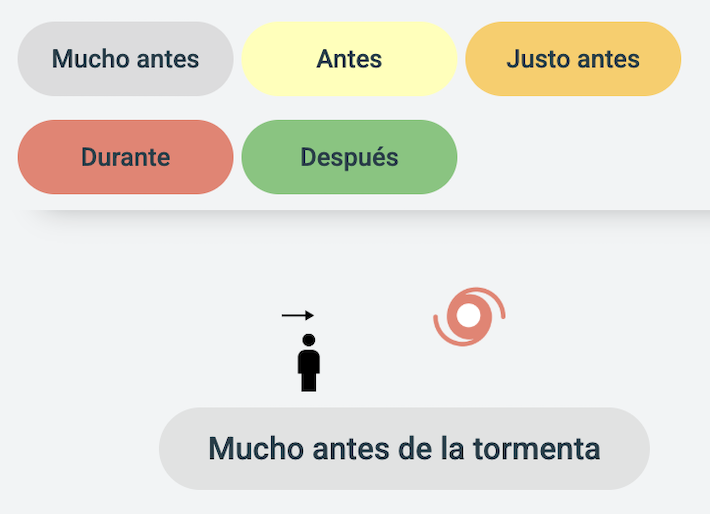
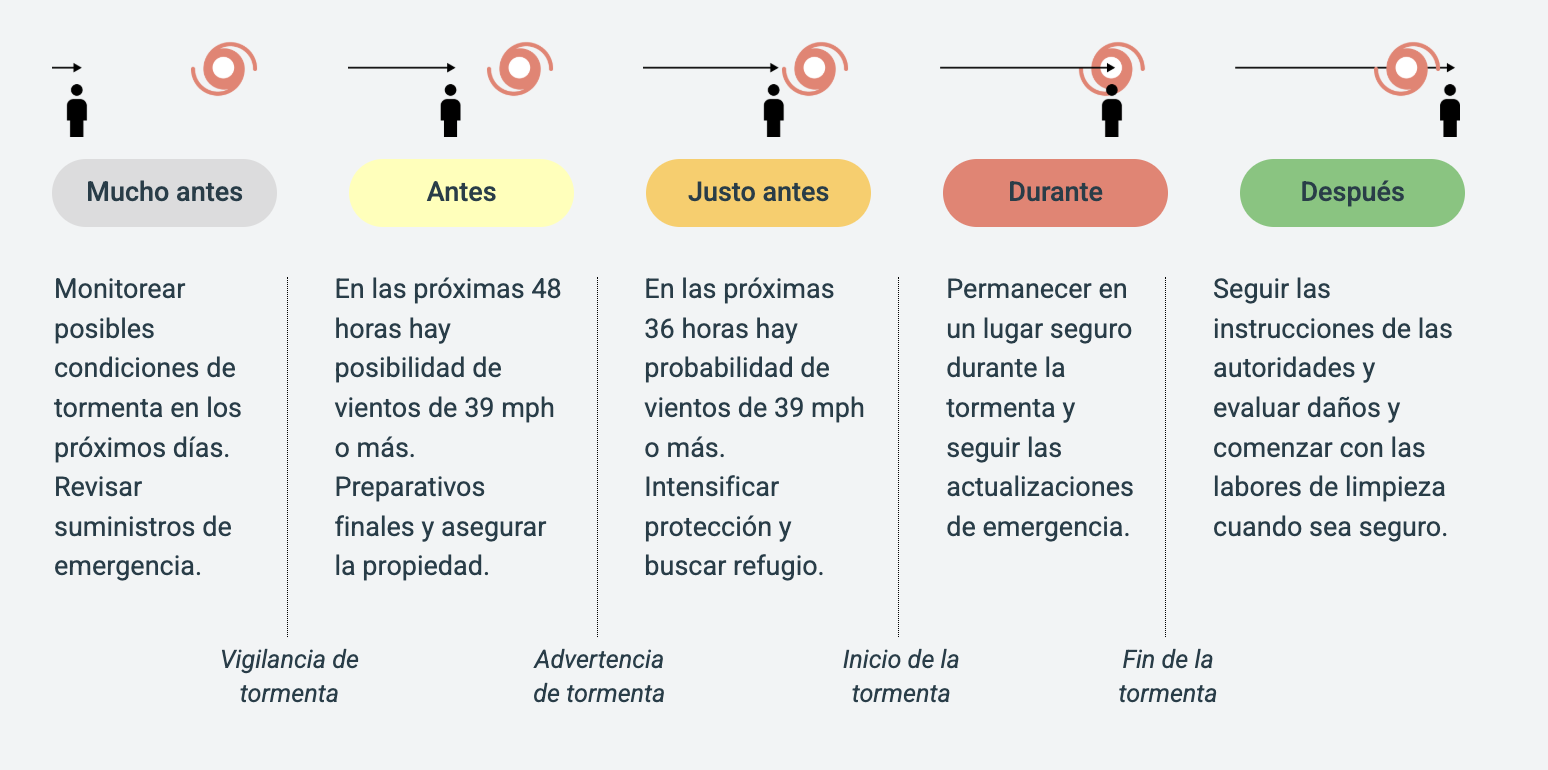
Get ready for an approaching hurricane with these essential steps to keep yourself and your loved ones safe
Visual Story • Pitch • Concept • Writing • Design • UX
Tools used

Univision
View project →
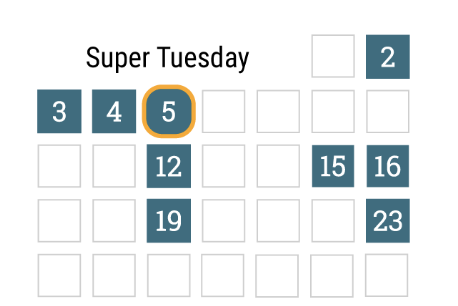
These are the key dates and events that will determine the Democratic and Republican candidates who will compete for the White House in November
Concept • Information Design
Tools used


La Vanguardia
View project →
We explore diplomatic talks between Spanish and U.S. leaders: from Suárez and Carter to Sánchez and Biden
Visual Story • Pitch • Concept • Reporting • Data Analysis • Graphics
Tools used

La Vanguardia
View project →
A graphical summary of legislative modifications and the cases in which penalties are reduced or extended
Visual Story • Concept • Pitch • Graphics
Tools used


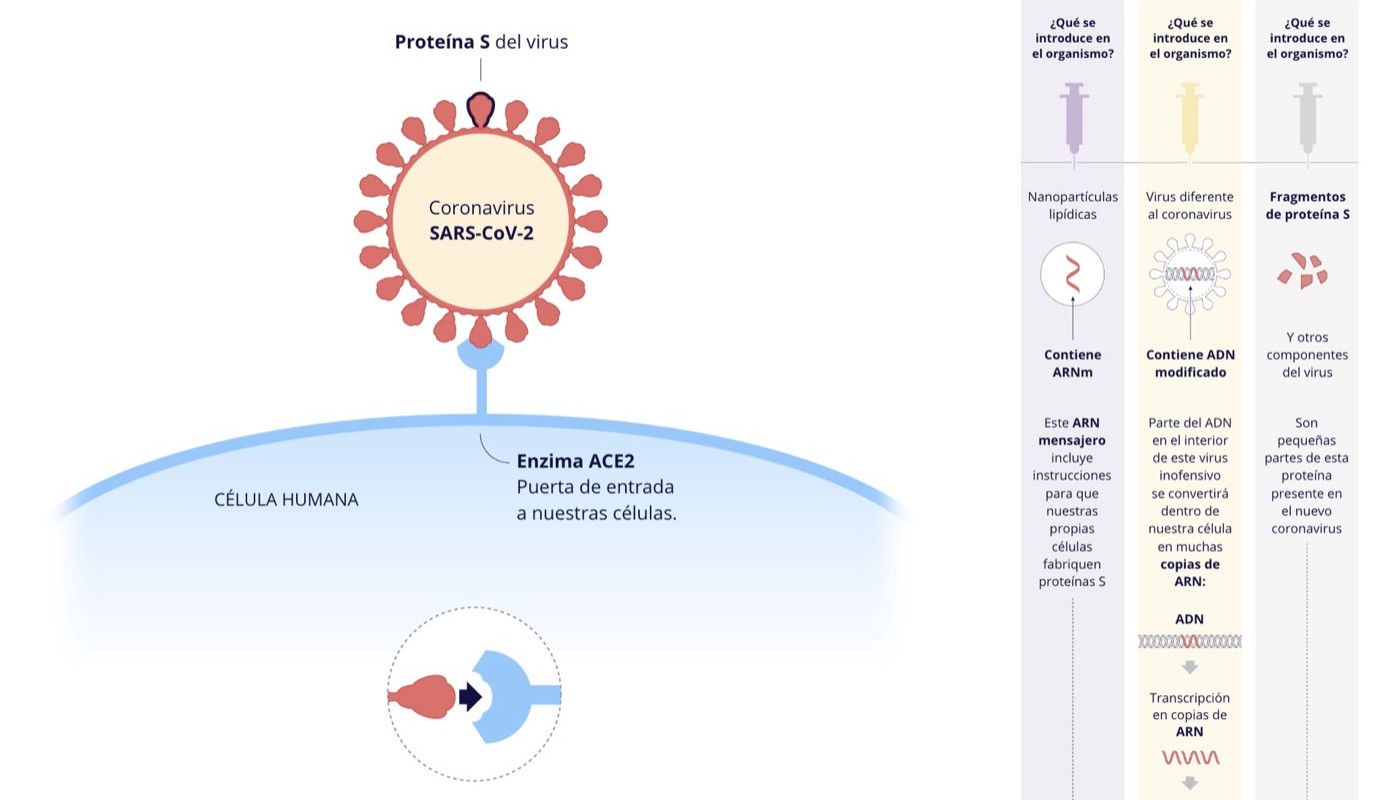
Government of Spain
View project →
My role
Led the concept, design and production of this user-centered vaccination website launched in December 2020. Rather than following typical government website conventions, the site opened with a data visualization answering the question every citizen had: "When will I be vaccinated?" I collaborated with a CSIC biologist to create infographics explaining vaccine mechanisms, ensuring comprehensibility across devices and different levels of health literacy. The site became a key public communication tool during Spain’s vaccination rollout.
Project Management • User-Centered Design • Concept • Editing • Graphics

Government of Spain
View project →
My role
Led the comprehensive redesign of lamoncloa.gob.es, the official website of the President of the Government of Spain, with a focus on citizen needs and communication clarity. The project addressed brand consistency, typography hierarchy, and content legibility across devices. Key improvements included a new press conference format allowing users to navigate by speaker and timestamp, and a dynamic ministerial agenda with photographs and names, bringing transparency and accessibility to the most visible government platform in Spain.
Project Management • User-Centered Design • Innovative formats • Branding • Typography

Government of Spain
View sample: Ministry of Health
My role
Led the design and implementation of a unified header system across all Spanish ministry websites, addressing brand inconsistency and poor mobile legibility throughout Spain’s public administration. I created design guidelines and provided implementation support and quality checks to ensure every ministry adopted the new standards correctly.
Project Management • Design guidelines • Implementation support • Quality assurance


Government of Spain
View project →
My role
Led the concept and design of this portal presenting Spain’s €140 billion European recovery strategy. The site featured hierarchical navigation explaining 10 policy areas and 30 components, plus a search assistant helping citizens and businesses identify funding opportunities from multiple government databases. The goal was to make one of the most complex policy frameworks of the decade legible and actionable for the general public.
Project Management • Concept • User-Centered Design • Editing • Graphics

Univision
View project →
See through the polls who are the favorites for the presidential nomination among the Democrats
Interactive • Visual Storytelling • Graphics
Tools used

Univision
View project →
Thousands of parents in the US follow the example of their favorite celebrities and they give their infants the same names they use for their children
Visual Story • Concept • Reporting • Data Analysis • Design • Graphics
Tools used
★ ÑH Society for News Design (SND) award

Univision
View project →
Univision News analyzed attacks of this type since the Columbine massacre in 1999
Visual Story • Concept • Graphics
Tools used

Univision
View project →
When it comes to criticizing Donald Trump, Joe Biden and Elizabeth Warren seemed to change strategy for the debate
Interactive • Concept • Data Analysis • Graphics • Design
Tools used

Univision
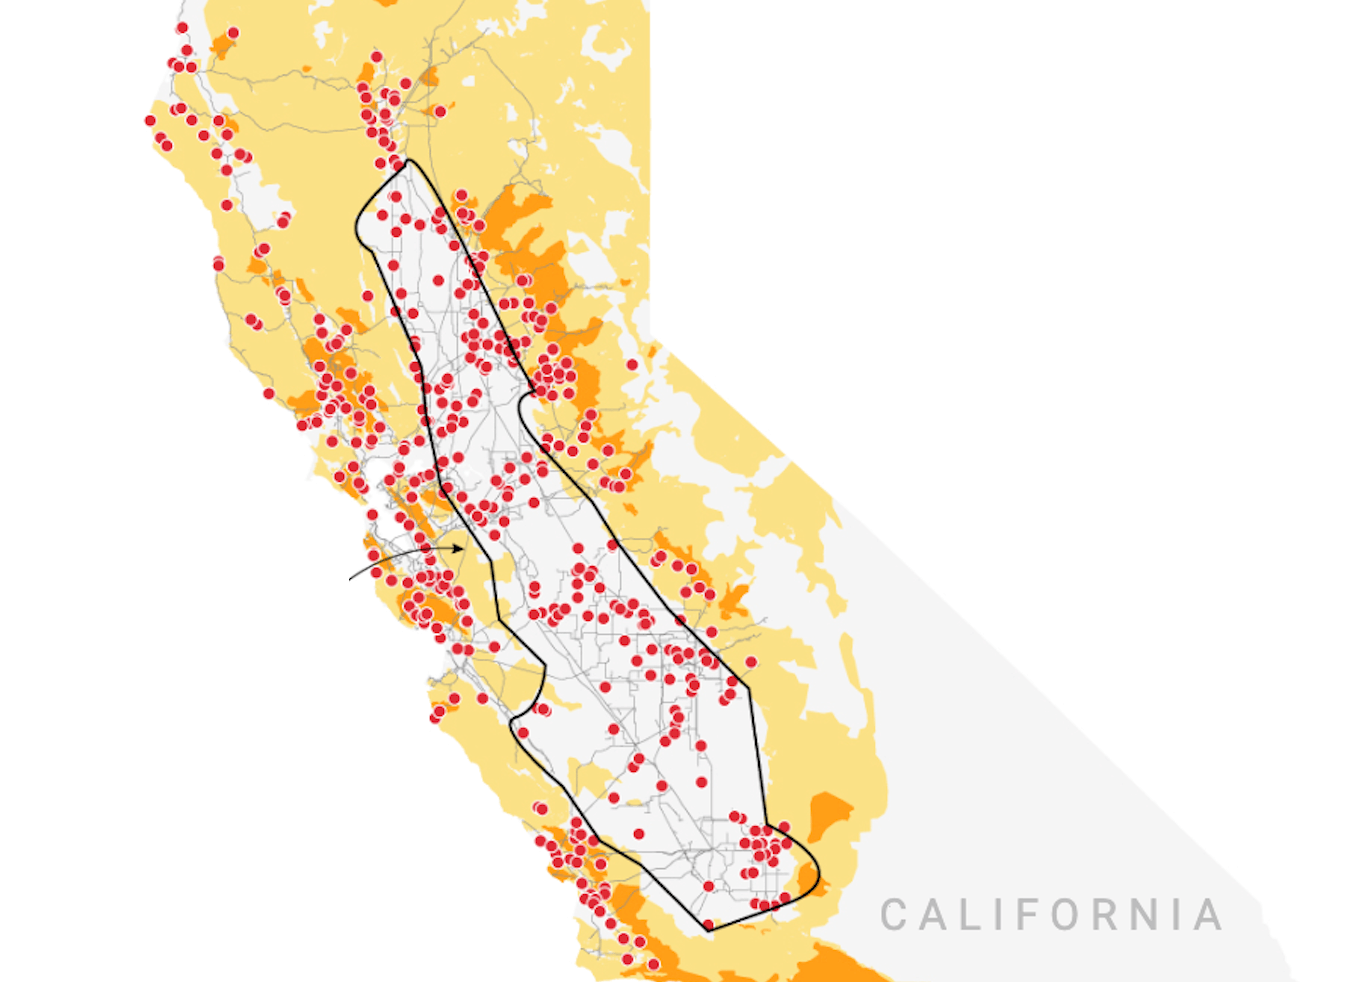
Massive fires in California: why is an electricity company in bankruptcy under the public eye again?
View project →
Pacific Gas & Electric, California main electricity supplier, investigates a fault in one of its towers that may be linked to the Kincade fire
Visual Story • Concept • Research • Data Analysis • Graphics
Tools used

Univision
View project →
See which candidate leads the polls today, how much money each one has raised and the amount of support they have received from other leaders of their party
Interactive • Concept • Graphics • Design
Tools used

Univision
View project →
Univision News asked the 23 declared candidates for the presidency what actions they would take on immigration if they enter the White House in 2020
Interactive • Concept • Graphics • Design
Tools used

Univision
View project →
After the first presidential debate Kamala Harris now stands as the current favorite among Hispanics eligible to vote in the primary elections
Data Analysis • Graphics
Tools used

Univision
View project →
The temple was in the midst of repair work when a raging fire broke out for hours threatened to reduce the temple to ashes
Visual Story • Concept • Graphics
Tools used

Univision
View project →
The singer was murdered, shot in the back, by a friend she was trying to help out
Visual Reconstruction • Concept • Design • Graphics • 3D
Tools used

Univision
View project →
We had Meghan Markle try on some wedding dresses – who wouldn’t like to see that? Take a look at how the most famous designs of royalty fit on her
Concept • Research • Design
Tools used

Univision
Style as Meghan was designed to empower consumers with verified insight into the Duchess of Sussex's wardrobe and styling choices
Product Design • Concept • Research • Database • Data Analysis • Graphics
Tools used

Univision
View project →
The cabinet has no Hispanics, the biggest minority in the United States
Visual Story • Pitch • Concept • Data Analysis • Design
Tools used

Univision
View project →
Discover the nationalities of the squad headed by German coach Jurgen Klinsmann. On the team, 17 of the 23 players have two passports
Concept • Research • Design
Tools used

Univision
The challenge began when Tottenham midfielder, Dele Alli, made this curious gesture to celebrate a goal.
Concept • Pitch • Reporting • Graphics
Tools used

Univision
View project →
'Despacito' is said in Mandarin 'Huan huan'. We show you how Luis Fonsi's song changed for China and other countries in the Asian market
Visual Story • Pitch • Concept • Design
Tools used
Maps
Vector Illustration
Diagrams, explanatory graphics and illustrations.